Challenge SC 2005 Girls’ ECNL – Player Development Data Profile
Posted On May 01, 2024

In the next of our soccer Player Development data articles on a single team’s output, we took three games from Texas club Challenge SC.
In the next of our Player Development data articles on a single soccer team’s output, we took three games from Texas club Challenge Soccer Club. We looked at three of their 2005 Girls’ ECNL games in May against:
- Oklahoma Energy SC
- Sting Soccer Club
- WSA Soccer Club
Like our recent articles in this space, we didn’t have access to lineup or substitution details, so we collected the data using positions as player names. All individual player & overall team data collected is available in 1H, 2H and 90 min categories.
Overall Team Data Performance
We will go into detail on some of our popular catch-all team metrics across defensive, attacking and possession data outputs. We will also include some granular data detail on some of these metrics.
Defensive: From a defensive POV, our most popular metric with our US & Canadian club testers in progressive regain – the % of times their players recovered a loose ball or intercepted an opposition pass and then followed up with a positive event straight after (ie. didn’t lose possession straight away). A 2005 team’s average progressive regain across our database is 81.06% – how does the Challenge SC 2005 Girls’ team compare?
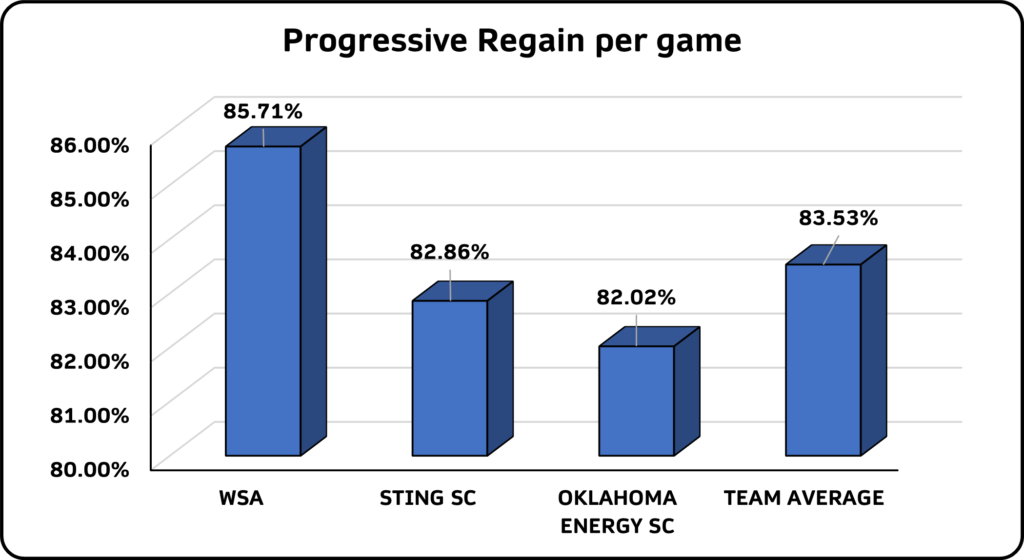
The answer: not badly at all. Above-average in fact. A very good performance in this respect against WSA SC and while there was a 3% difference across the other two matches, these games were still ahead of our database average. Let’s break this down further into the granular recovery & interception data that we collected.

To simply define progressive and unprogressive here, progressive means following up the loose ball recovery/interception with a positive action – unprogressive means the opposite; losing possession, giving away a foul etc. A standout here for us are the progressive interception numbers across the three games – the Challenge SC player are adept at reading the play & cutting out opposition passes.
Attacking: In this section, we will look at efforts on goal & their efficiency. The output on this metric across our database is very mixed – we have tagged teams with <20% shot efficiency and >75% shot efficiency. How does Challenge SC fare in this catch-all metric?
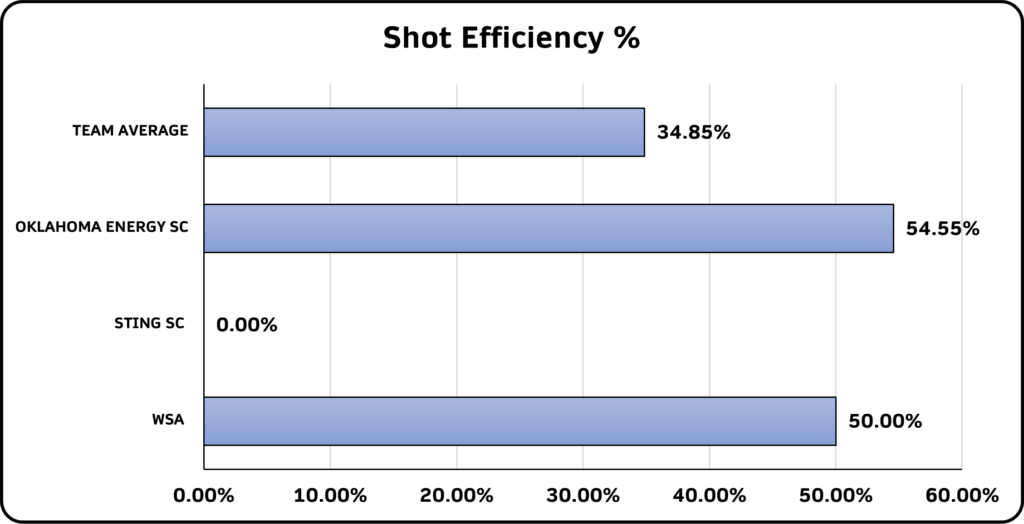
Slightly mixed results here – with 1 in every 2 efforts on goal finding the target in two games and no efforts on target in the Sting SC match. What does the breakdown of these efforts on goal look like?

They are very small sample sets, but the interesting thing for us is the low number of efforts on goal that were blocked. We have seen some very large numbers in games across our 2005 database – it seems here that Challenge SC players were able to get their efforts on/off target more than many teams we have tagged. Is this down to the players being coached into getting themselves into better scoring positions? Or the opposition being unable to cut out the efforts? Or both??
Possession: We have found that the possession data output we collect is of immense interest & importance to a lot of our testers – they are keen to objectively assess whether club styles/philosophies/visions are being implemented on the match field. One recent article suggested a club’s 2005 Boys’ team tended to play a lot more side/backwards passes than forward passes. Speaking with one of their executive team, they were impressed that we captured this insight & it rang true with how they set their teams up to play.
Can we gain any insights into Challenge SC’s style of play through the numbers?
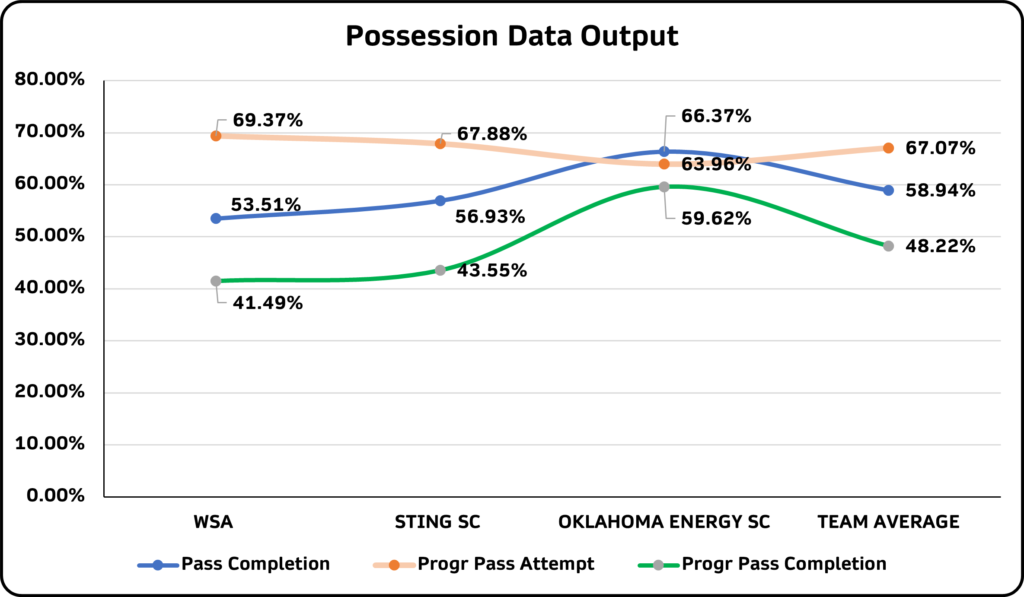
We see this a few times each week across our data collection – relatively low pass completion rates (ie. <60% pass completion). Taken at face value, it can often give an inaccurate picture of a team’s possession ability across a game. How conservative/risky were the side in possession? Riskier passes (ie. progressive pass attempts) often increase the possibility of losing possession, conservative passes increase the possibility of possession retention. Low pass completion %s and high progressive pass attempts can tell a different story than a low pass completion % and high conservative pass attempt rate.
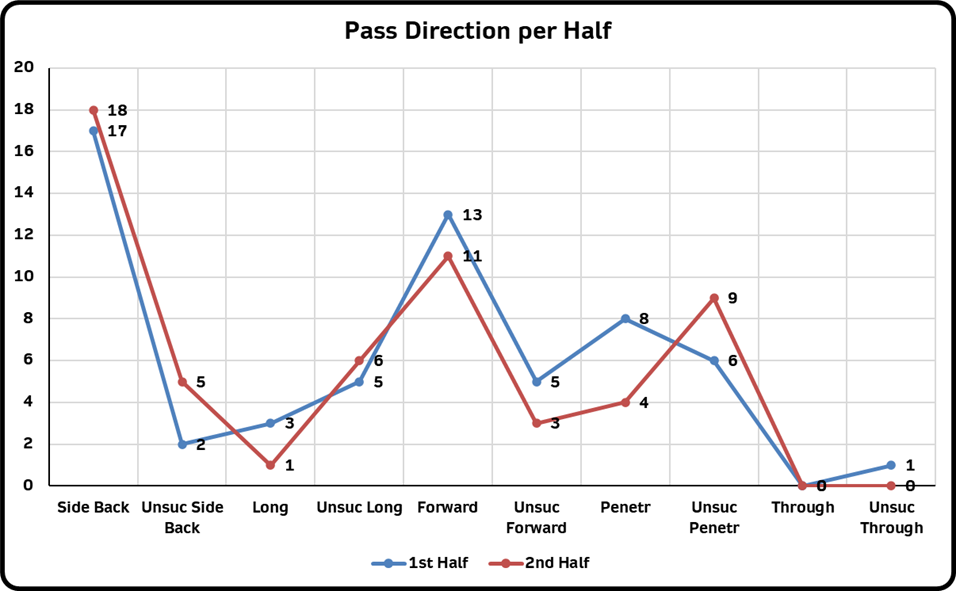
It should be noted that the 2005 Girls’ team here display an above-average progressive pass attempt rate (and average) – compared to other teams across our database. Let’s have a look at those possession direction data outputs.
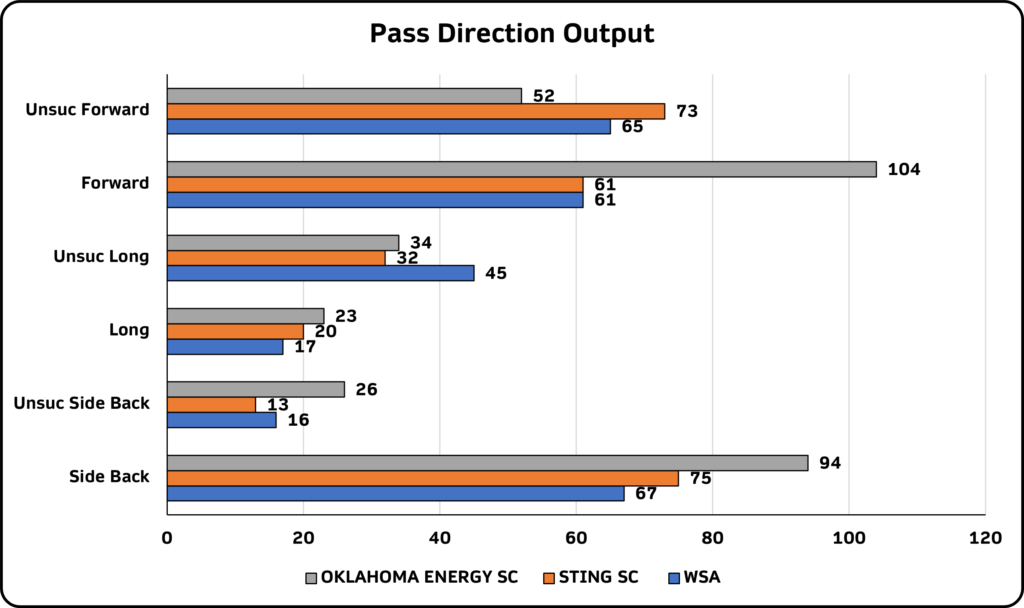
As you can see from these outputs, there is a greater attempt of passes towards the opposition goal than those conservative passes. While the coaches & Player Development staff will want to see a much greater pass completion rate than they currently have, the players’ ambition in possession must be pleasing.
Let’s take a closer look at one of the performances in possession – versus Oklahoma Energy SC.
As mentioned earlier, we tagged by position & traditional position number (ie. RB is #2, LW is #11 etc.) due to lack of lineup details. The graphic below shows the pass completion rate across the 11 positions against Oklahoma Energy SC (over the entire game). A bit of a mixed bag, where the two CMs are slightly above 3 in every 5 passes being successful but both wingers are well below-average in this game.
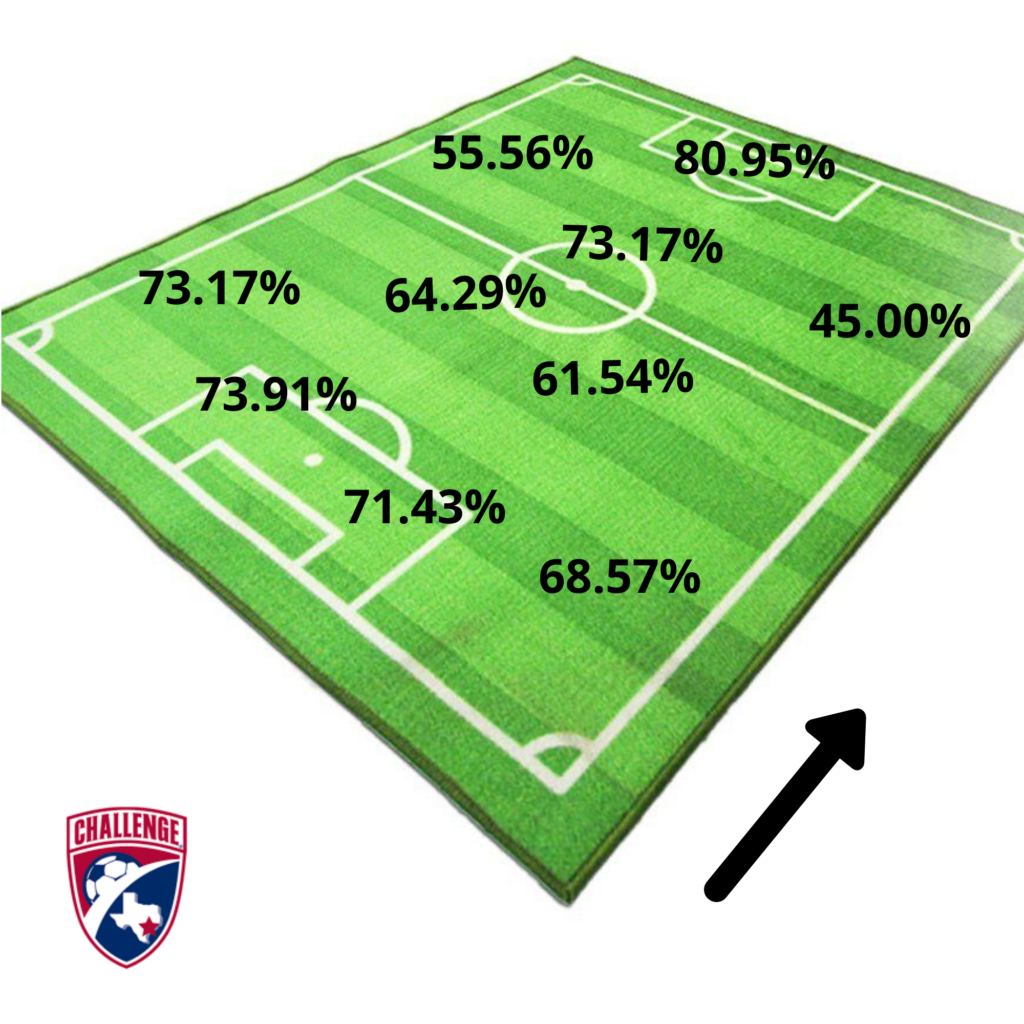
Let’s break this down even further – into 1H and 2H completion rates.

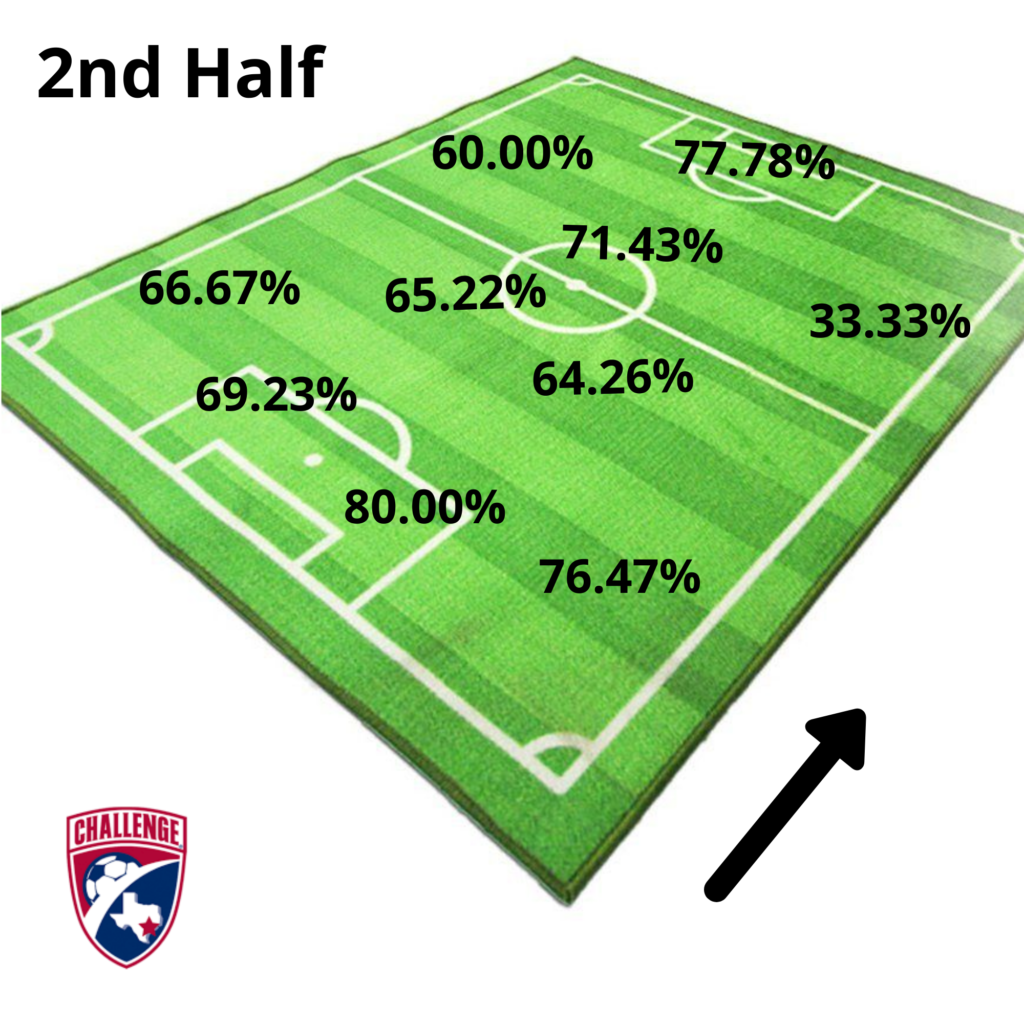
A few wild disparities here where some players’ completion rates differ more than 10% between the two halves. We do believe that this is where the coaches & development staff can utilize our data outputs effectively – adding their own unique context to the data output (ie. was the player up against a difficult direct opponent for a half, were they tiring as the game went on, was there a change in tactic from the sideline that meant a change in approach by the player)?
Numbers on their own can bring the expert eye to a finding/insight that they may not have seen during the game itself. We believe that only the Coaching & Player Development staff can take these data outputs & insights and put their own spin on them for future development use.
We have a vast treasure trove of data output on these three Challenge SC 2005 Girls’ performances. This data is categorized across 64 metrics & available in 1H, 2H and 90 min formats. It can be broken down by team output & individual player performance data output.
At PlayerStat Data, our 360° Player Development data platform will reimagine & revolutionise the way soccer clubs & academies deal with their youth players’ development pathways. Marrying five key facets of player development into one platform, clubs & academies will access a level of insights at PlayerStat Data that is unavailable anywhere else.
Reach out to us at info@playerstatdata.com for further information – clubs & academies, enhance YOUR own operations by fully powering YOUR players’ development pathways.
![]()
Leave a Reply
Your email address will not be published. Required fields are marked *