Ireland WNT performance data breakdown v Australia (21/09/21)
Posted On May 01, 2024
A blog on the performance data insights from the Irish WNT win against Australia on 21/09. Covering player & team data insights.
A memorable performance on Tuesday, with the entire squad (players & backroom) firing off a confident warning for next month’s WC qualifiers. In this piece, we look at the performance data that we collected across the entire WNT performance on Tuesday night and highlight interesting insights from the data.
Team Defensive Insights
From a team perspective, the slight increase in total defensive events between the first half & second half isn’t as wild as you would have assumed, with Australia chasing down an equaliser. In our datasets, standing challenges are exactly that and tackles are when a player goes to ground to win back possession. There is little difference in output across both halves in these two key metrics, giving a sense that the Irish players were under less pressure in recovering possession than would have been expected once they went 3-2 up.

What is interesting to note from the next graph is that the defensive success element increased across all metrics in the 2nd half, compared with the 1st half. Progressive Regain % is a metric we use to compare the number of ball recoveries & interceptions that are followed by a positive event to the total number of recoveries & interceptions. We use this as it gives a greater sense of the usage of the ball when the team recovers possession (e.g. is possession retained/lost when a player reads the game well and intercepts a pass?).

Efforts on Goal
From an attacking sense, the first half was really where the Irish team made their strongest impact (with two goals scored obviously). Interestingly, all but one effort in the first half came from the boot of an Irish player, whereas the second half had only two aerial efforts from Louise Quinn (both from corners). A symptom of the lack of territory in the 2nd half or another possible explanation?

Team Possession Data Insights
The final piece in our WNT team performance analysis concerns possession data – what did the Irish team do with the ball when they had it?
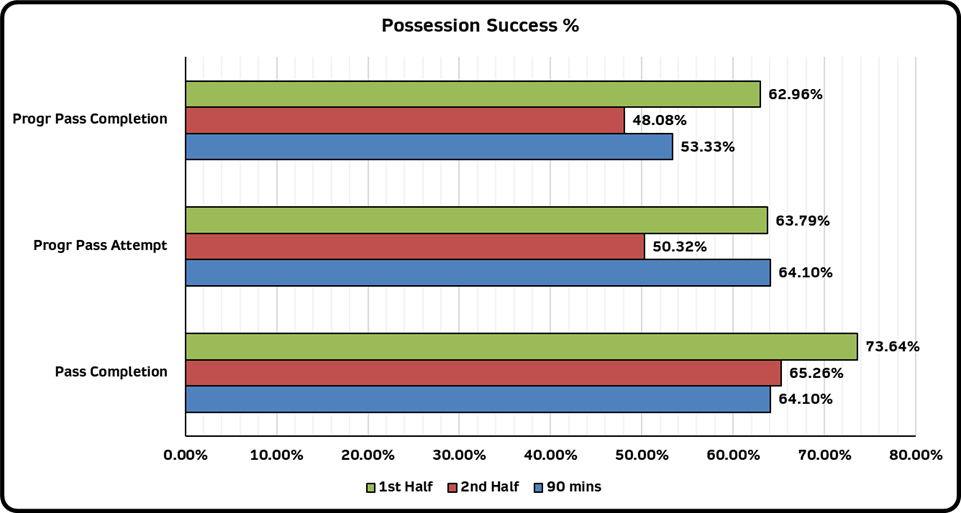
Again, like the defensive outputs per half, there’s not a huge difference between the possession data outputs from both halves. It was a steady performance in possession, not exactly losing possession in a panic when holding onto the one-goal lead.
In the below graphic, it is obvious to see the possession retention attempts in the 2nd half (i.e. fewer progressive pass attempts compared to the 1st half). This shows composure and patience in possession which is becoming more apparent across the entire international setup. Players are more comfortable with the ball at their feet & understand the value in controlling the game better by not always having to look for the progressive pass.
Player Insights
When it comes to player data insights, we decided to take the 5 defenders over the 90 mins and assess whether their workload (from a defensive standpoint) increased as the Australians looked for an equaliser in the 2nd half.
The success percentages did not wildly differ across the four catch-all defensive metrics apart from the 2.5 times increase in defensive aerial duel success.
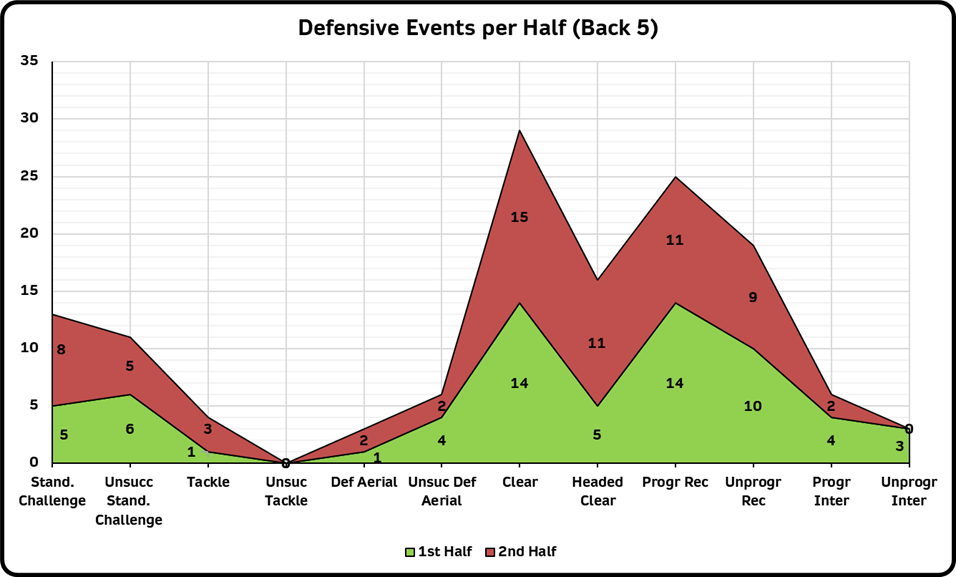
From the individual event breakdowns, you can see that there was an increased volume of headed clearances in the 2nd half (i.e. clearance made under little/no aerial pressure from an attacker). Louise Quinn, unsurprisingly, lead the way here with 7 headed clearances across the 90 mins (5 in the 2nd half).
Player Possession Data Insights
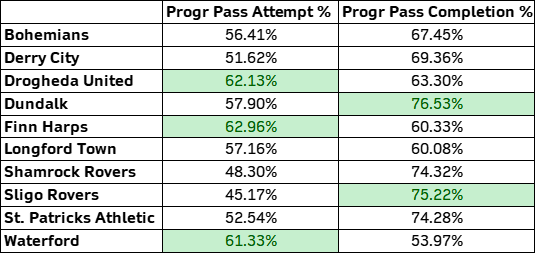
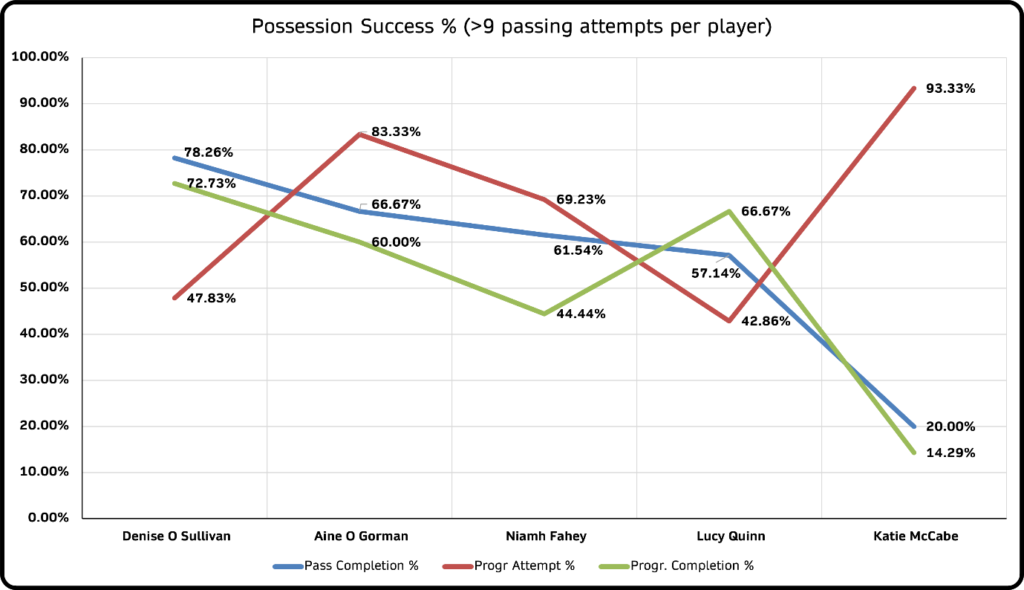
When looking at possession success rates (%s) across those players with more than 9 passing attempts in the game, there are some interesting findings.
Katie McCabe may have had a relatively low pass completion rate, but she was well in front of her teammates with the % of riskier/progressive passes attempted. Áine O’Gorman’s possession performance is possibly the most balanced of this set of players, with a 66.67% pass completion rate, 83.33% progressive pass attempt rate & completing 60% of these attempts.
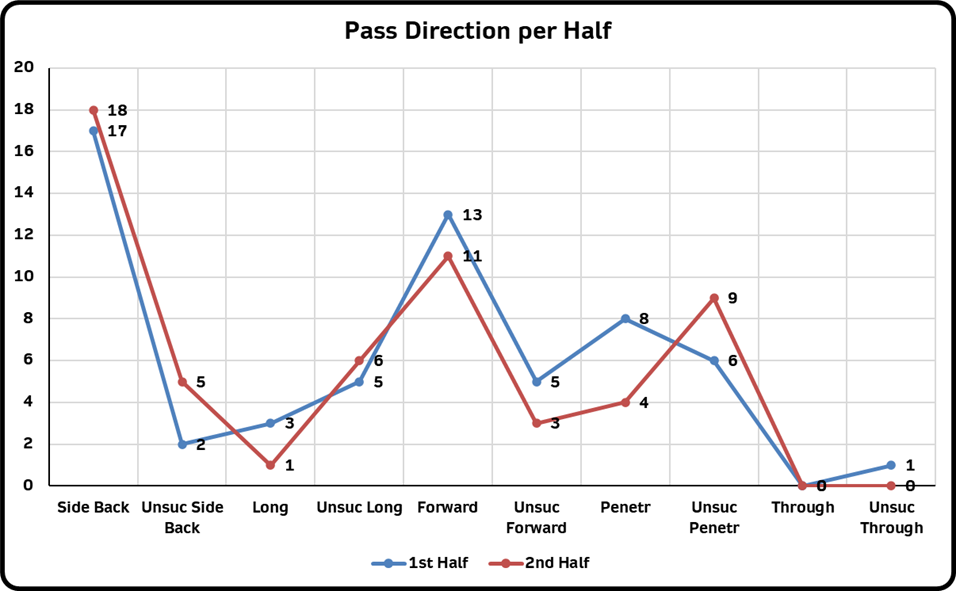
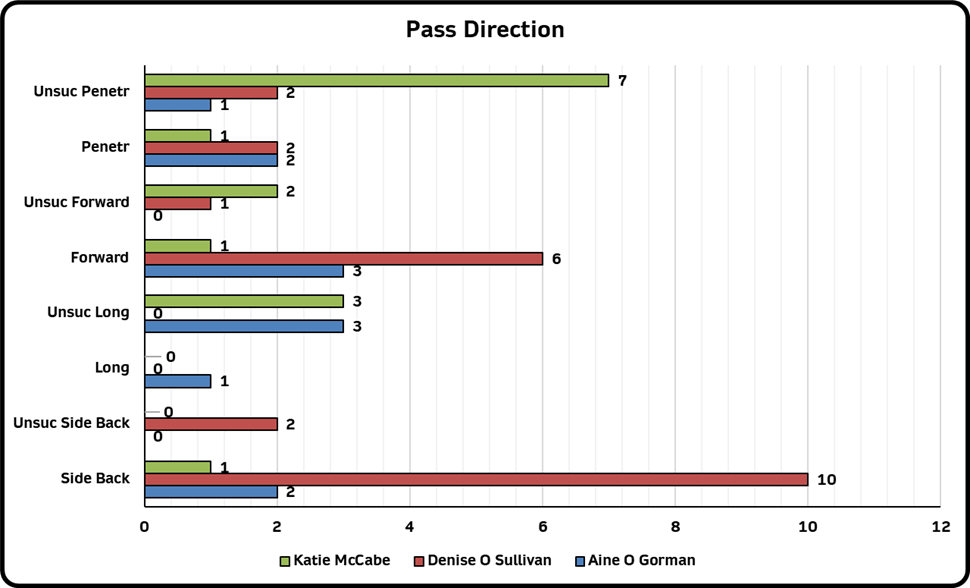
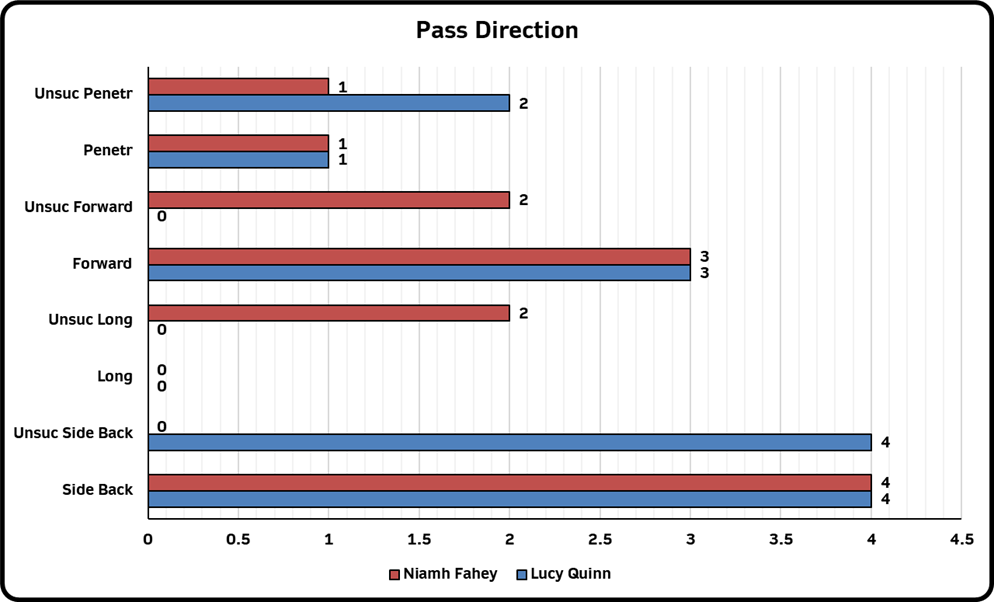
Taking these five players’ possession outputs with directional context to the figures above, you can see some outliers:
- Denise O’Sullivan was the tempo-setter, with many side/backward passes to maintain possession and control the pace of the game & twice the number of successful forward passes to get the ball into the advanced players’ feet.
- Katie McCabe’s penetrative pass attempts (looking to break opposition lines) was double the next-closest member of the team.
- No through balls (as per our definition) attempted on the night.
We have collected just over 1700 individual Irish player performance datapoints across 14 outfield players, broken down into 1H, 2H and 90 min outputs by our data analyst team. This data is also broken down into team performance insights, with catch-all metrics showing the overall side’s performance across metrics in the first half, second half and 90 min performances.
There are many more individual insights available from this game due to the in-depth work of our soccer & data analysis teams. At PlayerStat Data, we power the high-performance goals of our clients through intelligent & bespoke performance data insights that they can trust. This article will give a taster of the level of insight our data teams go into across our operations.
![]()
Leave a Reply
Your email address will not be published. Required fields are marked *