London TFC 2005 v Cambridge SC 2005 – OPDL
Posted On May 01, 2024

For this article, we took a different approach – we looked at two 2005 teams in the Ontario Player Development League (OPDL)

For this article, we took a different approach – we looked at two 2005 teams in the Ontario Player Development League (OPDL); specifically looking at two matches where they played each other in the month of May (home and away). We looked at London TFC Academy 2005 & Cambridge SC 2005.
Trying something different, we decided to apply different tagging models to both teams. We collected the following data from both games:
05/08 – London TFC (Defensive & Possession only) v Cambridge (Attacking & Poss.)
05/29– London TFC (Attacking & Possession only) v Cambridge (Defensive & Poss.)
Like recent articles in this space, we didn’t have access to line-up or substitution details, so we collected the data using positions as player names. All individual player & overall team data collected is available in 1H, 2H and 90 min categories.
First Game – 05/08
Let’s look at the team possession outputs as a whole across the two games – did any side dominate possession across the two games or was it relatively even?
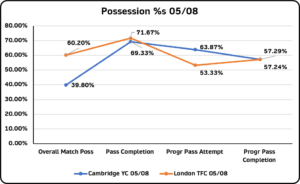
As you can see above, London TFC 2005’s dominated possession in the first game. There was close to a 60/40 split in favour of London TFC – but we don’t want to focus too heavily on that. How effective & efficient were both sides in possession?
With respect to pass completion %s (we believe this % needs greater context), both Cambridge & London TFC were relatively similar. Coming in at just below the 2005 Boys’ average (as per our database) of 69.33% and 71.67% respectively. Were the sides progressive in possession (looking to break lines & pass towards the opposition goal) or conservative (passing sideways/backwards at a steady, patient pace)?
London TFC were slightly below our 2005 boys’ database average with a 53.33% progressive pass attempt rate – meaning just over 1 in every 2 passes were made towards Cambridge’s goal. Cambridge SC were above average for a 2005 Boys’ side (according to our own benchmarking numbers), with a 63.87% progressive pass attempt rate.
Completion rates are pretty much the same for both teams at just over 57%. Not a bad return, comes in slightly above the 2005 Boys’ average.
How consistent were both sides in possession across the game? A good first half and a poor second? Vice-versa? Or steady through the game?
Possession Breakdown by Half
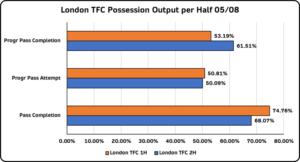
London TFC’s possession output across both halves is relatively consistent – across the game, one in
every two passes attempted went towards the opposition goal. Completion rates wavered between the halves – hard to know from the numbers whether this was due to player fatigue from one/both sides etc. but definitely some interesting insights for the London TFC coaching staff.
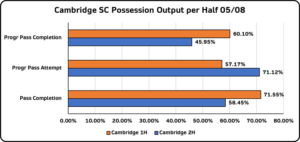
Cambridge SC’s output was a bit more scattered across both halves. There doesn’t appear to be much of a trend across the game (small sample set, admittedly). The standout output for us from this chart is the very high progressive pass attempt rate (71.12%) in the second half but a low 45.95% completion rate. This would be one of the larger disparities between progressive attempts and progressive completion rates that we have seen so far.
Second Game 05/29
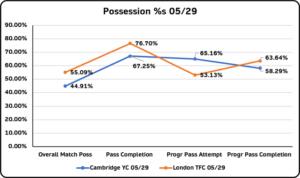
Notable to see that in the second game just three weeks later, Cambridge had a greater share of possession than they had in the first game (an improvement of just over 5%) and a slight increase on all things progressive passing (attempts & completion rates).
From a London TFC point of view, their pass completion %s were over 5% higher & this is all the more
impressive with a 5% increase in the progressive pass completion %s also. They completed more passes (by proportion) in the second game and completed more in a progressive manner than the first game too.
Let’s see how the breakdowns across each half compared to the outputs from the 05/08 game.
Possession Breakdown by Half
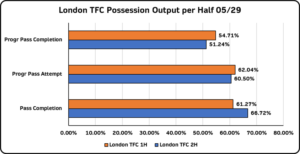
As with the 05/08 game, a relatively consistent possession output across both halves. Apart from the improvement in second half pass completion %s (an increase of close to 5.5%), there is nothing that hugely stands out from this output. What about their opposition?
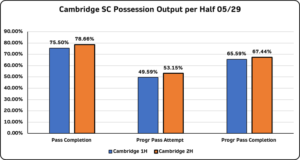
A much-improved performance in consistency in possession across the 05/29 game – there is even a noticeable trend of an improvement across all possession outputs. Again, without us having a greater context around the games (and the preparation & tactics), we are talking about the numbers from a purely statistical point of view. There is a marked improvement (statistically) in Cambridge’s possession outputs between the first and second game.
In our next article, we will go into a bit more detail around possession chain data outputs.
Numbers on their own can bring the expert eye to a finding/insights that they may not see during the game itself. We believe the Coaching & Player Development staff can take these data outputs, put their own context on them and enhance the progression for each player.
We’ve collected a vast treasure trove of performance data output across these two matches. The data is categorized across 64 individual metrics & is available in 1H, 2H and 90 min formats. It can be broken down by team output & individual player performance data output.
At PlayerStat Data, our 360° Player Development data platform will reimagine & revolutionize the way soccer clubs & academies deal with their youth players’ development pathways. Marrying five key facets of player development into one platform, clubs & academies will be able to access a level of insights at PlayerStat Data that are unavailable anywhere else.
Reach out to us at info@playerstatdata.com for further information – clubs & academies, enhance YOUR own operations by fully powering YOUR players’ development pathways.

Leave a Reply
Your email address will not be published. Required fields are marked *