Player Possession Blog – LOI Premier Division Week 1 – 9
Posted On May 01, 2024
A detailed blog on player possession trends in the LOI Premier Division over the first 25% of the season. Enjoy!
Player Possession Data
On the back of our detailed blog on team possession data earlier in the week, we now highlight the player-specific possession data output. For the quality of the datasets, we are including players who played 450 mins or more across the first 9 gameweeks of the 2021 SSE Airtricity Premier Division season.
Pass Direction Data Output
At PlayerStat Data, we think it is crucial to give players as much context as possible into their possession output – pass direction, passes per 90 and even breakdown possession trends across 1st half performances and 2nd half performances. Here, we will highlight some of the direction trends and who tends to stand out from the rest over the first 25% of the Premier Division.
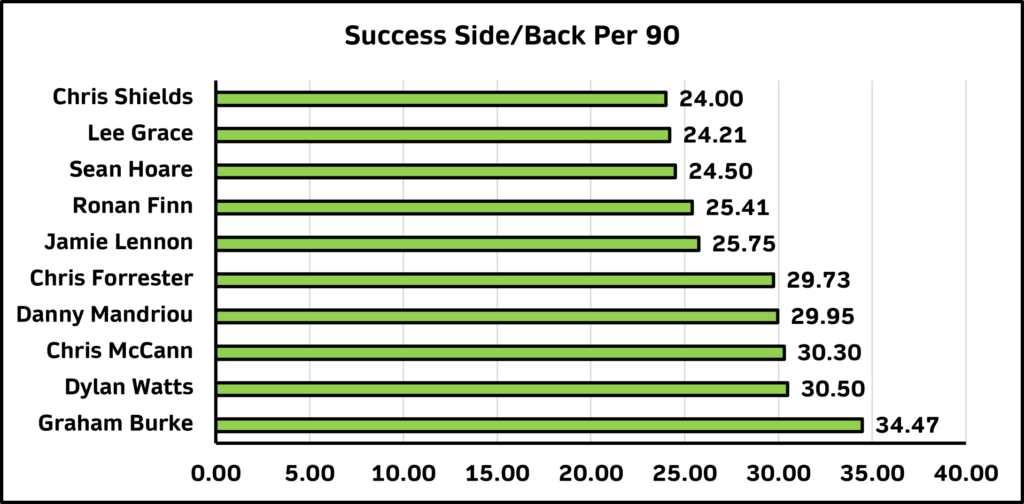
As we saw from the team possession blog, the same clubs tend to control possession across the first 25% of the season. As the player-specific blog will highlight, players from these clubs populate the Top 10 quite often. With the possession-dominant approach of Shamrock Rovers, it is not surprising to see the top 10 successful side/backwards passers per 90 come from Shamrock Rovers – important to control possession first & develop from there.
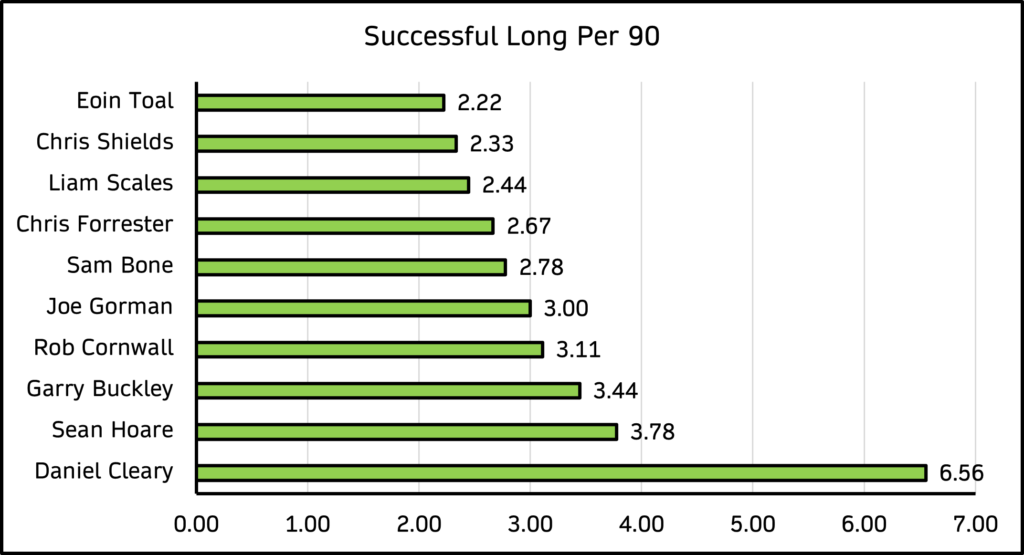
We define a long pass as one that travels a specific distance (or further) towards an opp. goal – not your usual hoof from back to front and the negative connotations that brings. Unsurprisingly, it is the centre half role where the long balls tend to emanate from.
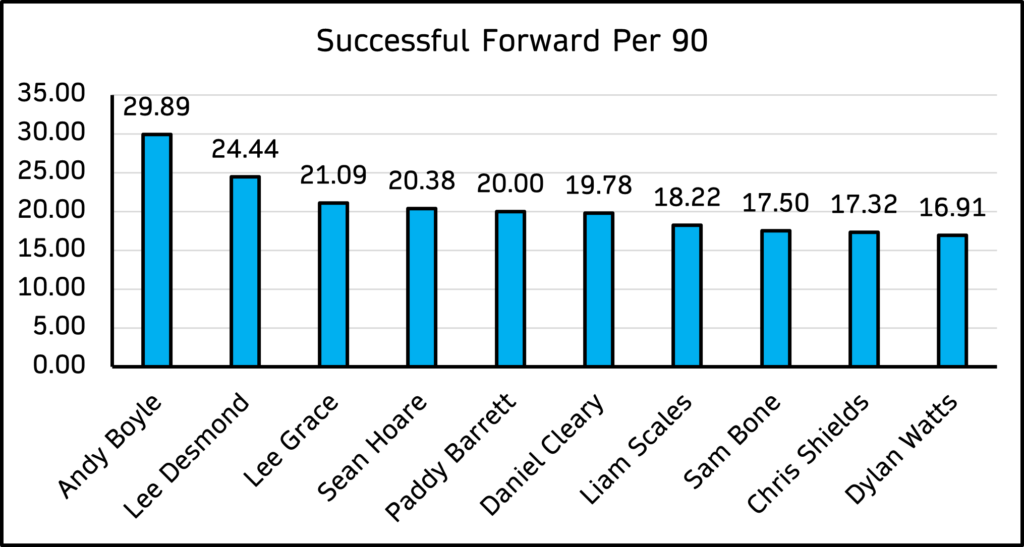
For us, a forward pass is simply a ball to a teammate’s feet (less than 25m away and with no opp. player in the passing line). The shorter distance for this pass is what differentiates it from a long pass. Again, the defender element stands out again with 8 of the 10 players being defenders first and foremost (the likes of Shields and Watts also have that defensive element to their game).
We also collect data on penetrative passing output (a pass that breaks opposition lines) and through balls (with specific requirements to be met to be considered a through ball). These passes (along with forward and long passes) are progressive – passing towards the opposition goal. We already highlighted in our previous blog that Waterford FC, Finn Harps and Drogheda United attempted the highest proportion of pass attempts towards the opposition goal (mirroring their direct styles) but does this ring true for individual players??
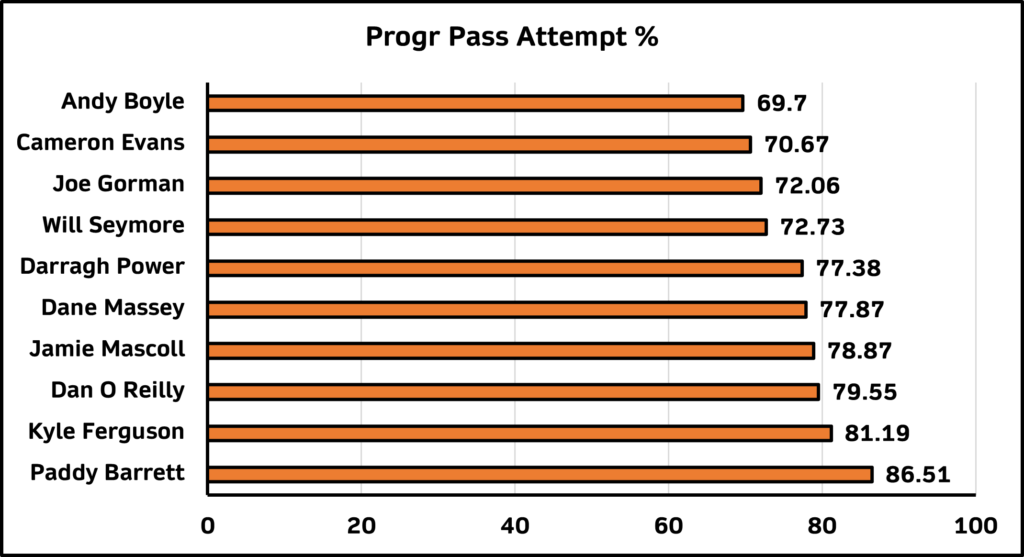
Yes and no, but there is a wider split among the clubs in this graph. Waterford, Finn Harps and Drogheda are represented (whereas they were not in previous graphs in this blog), but we find Dundalk, St. Pat’s and Longford Town players in here also. Unsurprisingly again, defenders are the trend here (with Will Seymore acting as a dynamic DM of sorts at Finn Harps). Do the players remain in the top 10 when we capture completion %s?
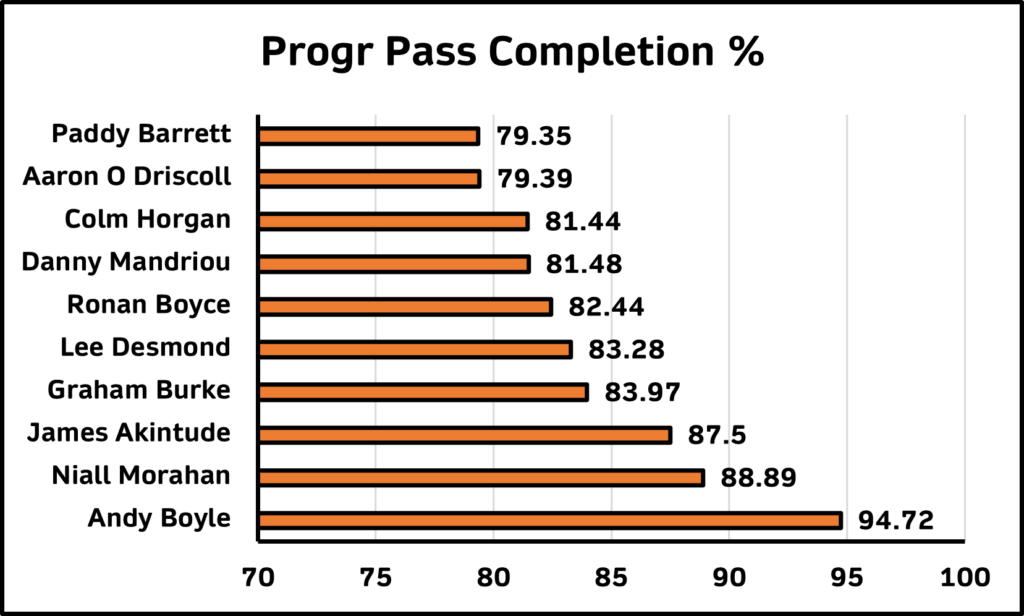
There is a huge change of personnel in this graph, some players featuring here for the first & only time in the blog). Only Andy Boyle & Paddy Barrett featuring in both Top 10s. Andy Boyle’s output is top class, with just under 95 from every 100 passes towards the opposition goal finding its target. Way out in front of the next best.
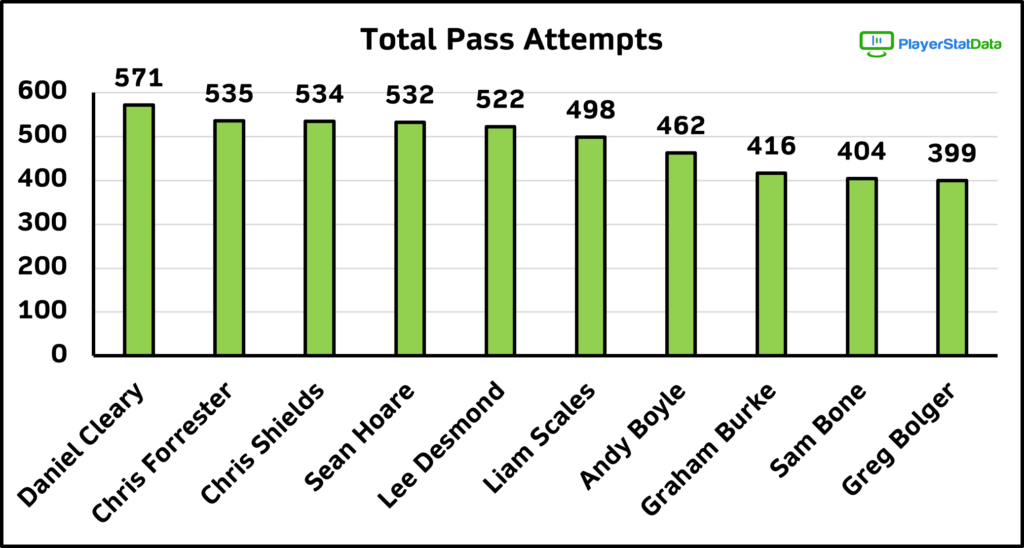
Total Possession Data Output
There is a bit of a swing between the top 10 players for total pass attempts, including players from Dundalk, Shamrock Rovers, St. Pat’s & Sligo Rovers. It is also interesting to note 6 of the 10 players in this graph are defenders, exploiting the time and space afforded to defenders in today’s game.
What is the pass completion outcome overall however? We feel that pass completion is a nice-to-know metric, but tells little about the risk/progression of a player in possession.
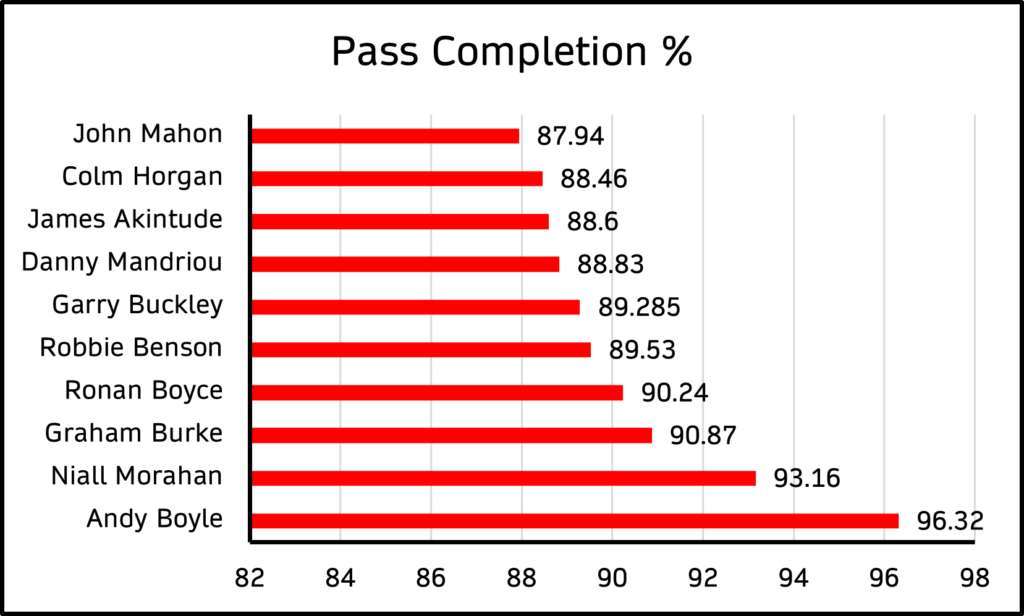
Once again, Andy Boyle is out in front with an astonishing pass completion %. We learned in the previous section that a large proportion of these were progressive/riskier in nature.
We also see a larger spread also across clubs & positions (as we hoped to see) with Sligo Rovers, Derry City, Dundalk, St. Pat’s and Shamrock Rovers accounted for here.
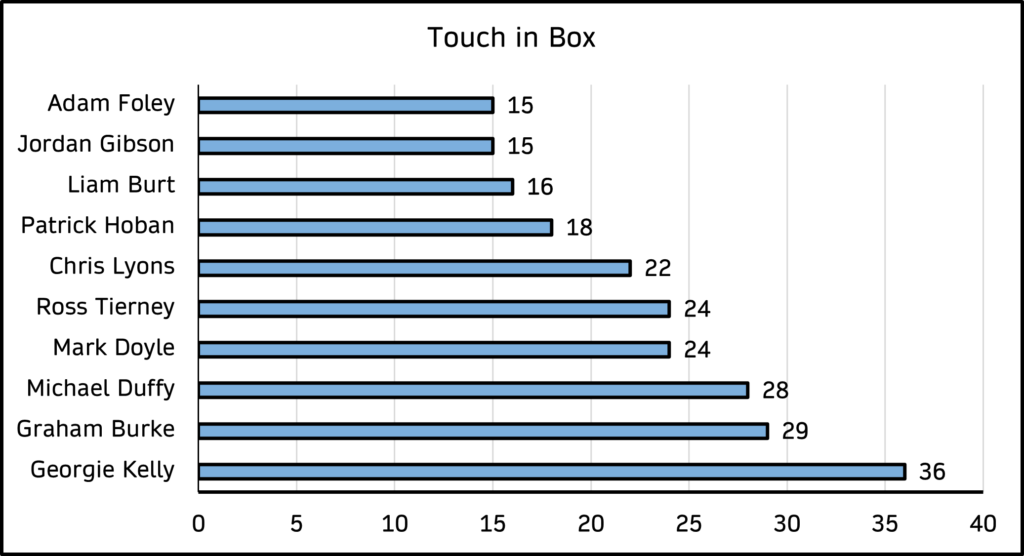
Who established possession most often in the opposition penalty area? In our ‘touches in box’ graph, we count the number of times the player establishes firm control of possession in the opp. box, not the amount of times they actually connect with the ball (i.e. a player dribbling from the 18 yard line to the end line is tagged as 1 single event and not the amount of touches taken to get from A to B).
Our last interesting, positive metric is that of pass attempts into the opposition box – these are counted if successful or unsuccessful, as it gives a greater indication of which players are looking to get the ball into the danger area more often.
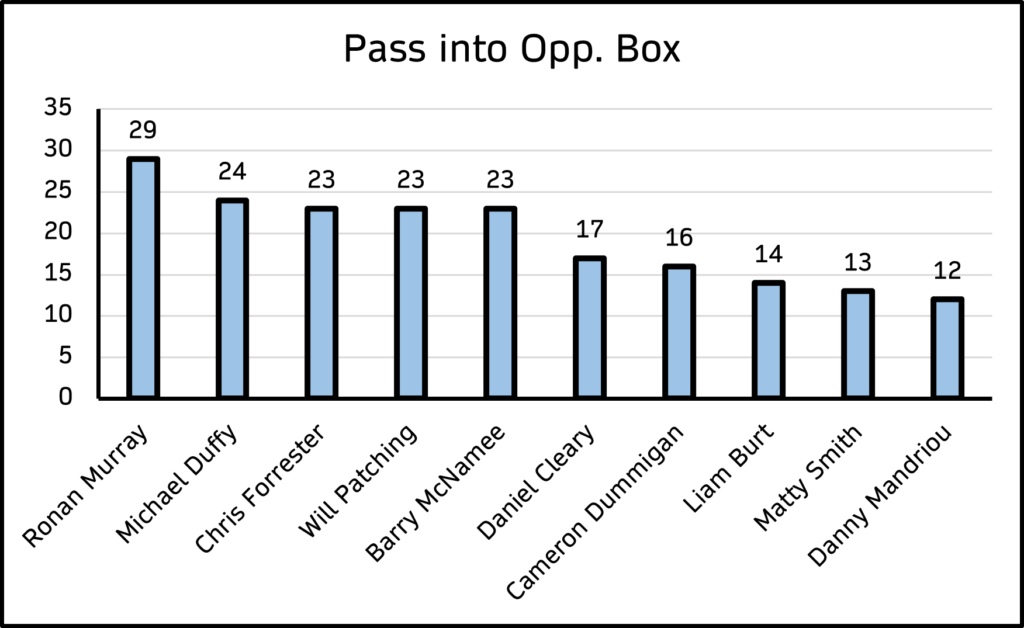
Again, as you would expect – attacking options weigh heavily in this graph, but interesting to note two Dundalk defenders in this list (Cleary and Dummigan). Will Patching has been a key part of Derry City’s creativity so far this season and not surprised to see him here. As Liam Burt begins to find his feet more & more at Bohs, we expect to see his impact magnified over the next 9 games.
The Unsuccessful Stuff
Our player data products are designed for players to get exactly what they want from their performance output. See what they want to see from their data, not what we think they want to see. Our data will help drive performance improvements in players and this can only be done with strengths AND weaknesses in performance trends. With that in mind, the final two graphs highlight those who have been that bit weaker in possession than most:
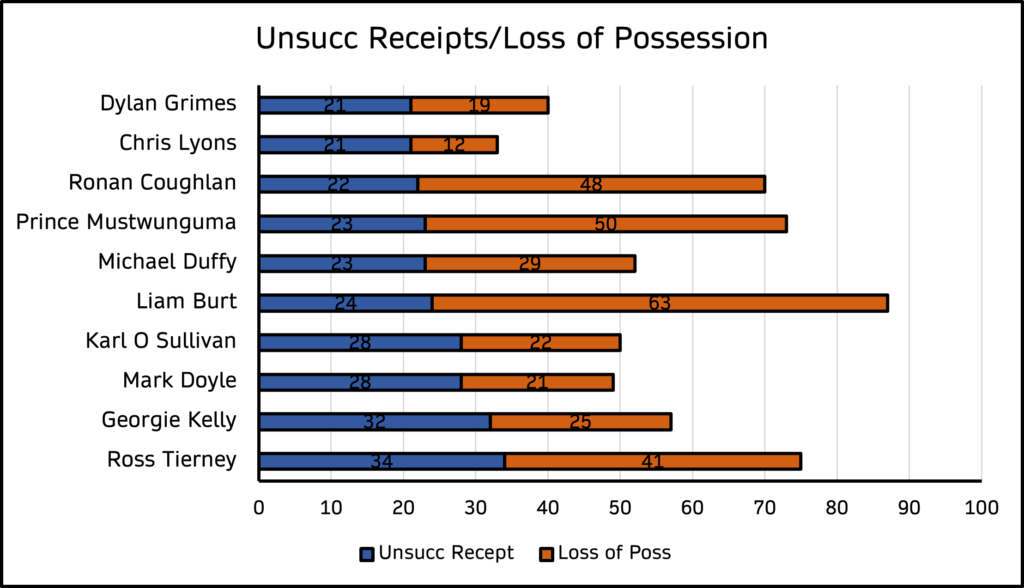
An unsuccessful receipt is an event where players fail to take possession of a ball when expected. A slightly subjective metric, but we tend to tag the more obvious events as opposed to finding a few ‘what-if’ scenarios. On the other hand, loss of possession covers events that include being dispossessed in a tackle by a defender or running the ball out of play, for example.
Our final graph covers those with the highest unsuccessful pass attempts per 90 mins played. Levelling out the playing field per mins played, instead of the highest overall totals.
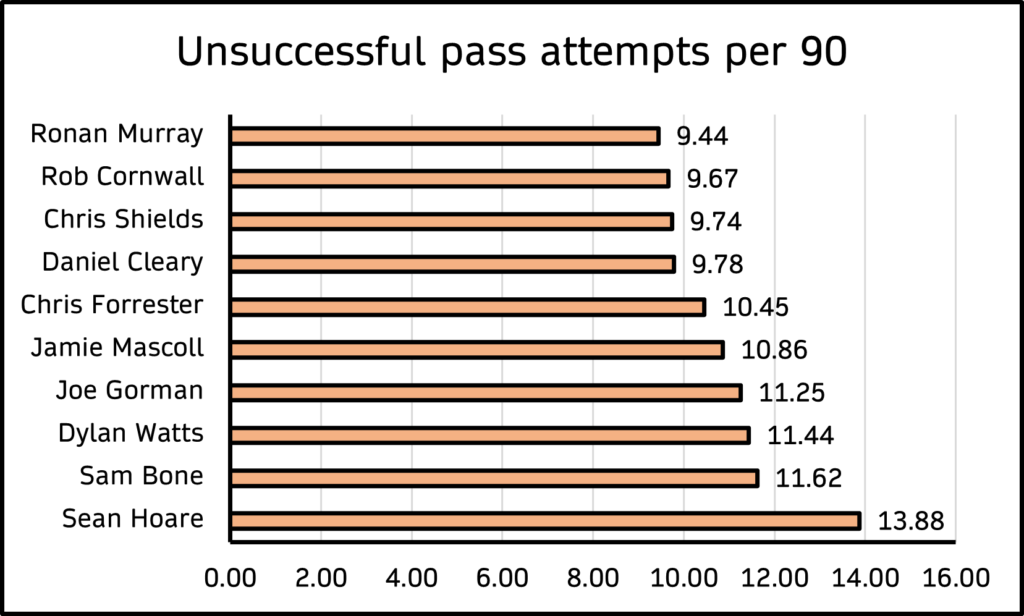
It is interesting to note some of the players on this graph are those that tend to be in possession more often than most. This leads to the “you can’t miss a shot if you don’t take one” premise and is not necessarily a negative in many cases. We would expect players in possession well over 50 times per 90 mins to have a slightly higher unsuccessful rate and this is a key point to take from this graph.
![]()
Leave a Reply
Your email address will not be published. Required fields are marked *