PlayerStat Data Case Study (USA): U17 Player Development Data Platform
Posted On May 01, 2024

PlayerStat Data worked closely with a USA-based U17 team as part of testing their 360° Player Development data platform. Read more.
PlayerStat Data’s on-field player performance data output is collected by a team of experienced analysts with a strong background in youth player development. It is our passion & focus to provide the data insights that allows soccer clubs & academies to power their own youth player development pathways.
Over the past 8 weeks or so, we have worked closely with an American soccer club on a test project. Working with their U17 setup, our analysis team tagged each match over an eight-game period; providing post-match insights & player data reports for their coaching staff & Technical Director after each game.
Close to 9,400 individual player data points were collected across the 8 games, with every single player event (ie. data point) clipped into accessible & downloadable 20 second video clips. All data points are available in the below data groupings:
- First Half data output
- Second Half data output
- 90 min data output
- Running total by player
- Running total by position
- Running total by team
With the permission of the club (who prefer to remain unnamed to protect their current performance data advantage), here is the story of our test project & some interesting player insights.
Format of games:
From the end of March to the middle of May 2022, our test club partner played eight matches: a small regional tournament (consisting of three games over three days) & five friendlies (one indoors, four outdoors). Each game consisted of two 40 min periods with rolling subs.
Number of players used:
The club utilised 24 players over the eight games, starting with the same XI on three occasions. Rolling subs were used throughout each game, with only three changes made across the entire 320 mins played in the first halves. A number of different formations & variations on standard formations were used.
Possession Data Outputs
Our test club partner was able to access possession data output across a variety of metrics:
- Pass direction (broken into 3 facets)
- Line Break Attempts
- Loss of Possession
- Passes into Opp. Box & Player Possession Events in Opp. Box
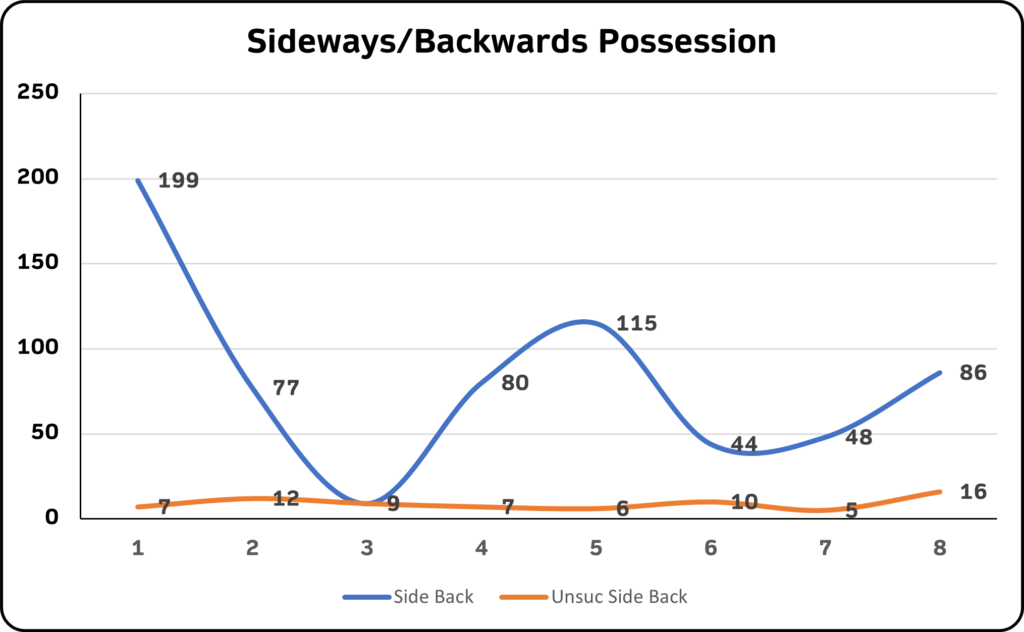
The coaching staff (and Technical Director) were able to closely monitor & assess players’ performances in possession. A key finding for them early in the test process was players were being too conservative in possession – keen to hold onto possession safely than being progressive & trying riskier passes.
As you can see from the chart below, there were nearly 200 sideways/backwards passes in the first game of the regional tournament. This was anathema to how the coaches want the team to play – players were happy to keep passing short & conservative & making the opposition chase the ball. As you can see, this trend was stopped from becoming an issue after the first game, where the players were encouraged before the second game to be more progressive when in possession.
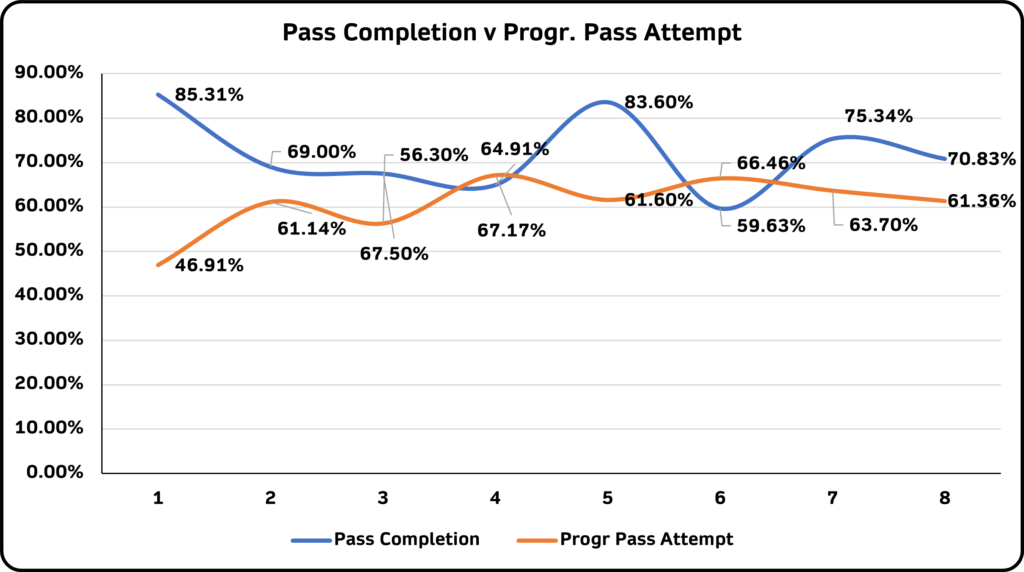
The impact of this change was apparent over the remaining seven games, when looking at pass completion %s versus progressive pass attempts. The coaching staff recognized that not enough possession attempts were towards the opposition goal & gave more license to the players to be riskier in possession. This meant that over the next seven games, players were expected to be less conservative in possession & realize that riskier pass trajectories increase the chances of losing possession.
The chart below shows the huge gap between pass completion & progressive pass attempts in the first game & how the gap narrowed over the rest of the test period:
Speaking with the U17 Head Coach for this case study, he said:
“We had an idea from the sideline that the players were holding back in possession, but we didn’t realise the extent until we saw the data output after the first tournament game. We communicated this straight away & encouraged more adventurous passing – we also had to remind players that risk brings higher chance of failure & they must embrace that”
Defensive Data Outputs
The testers were not too concerned at this stage of their preseason around the defensive facets – over these eight games, possession and efforts on goal were paramount as part of their pre-season plan. When it came to defensive output, the club’s Technical Director was keen however to assess players’ ability to retain possession once they had won it back from the opposition.
At PlayerStat Data, we utilise a metric known as progressive regain – the % of times a player wins back possession & follows the defensive event up with a positive possession event. When putting together a plan for this test, the Technical Director mentioned:
“We want all players at our club to have the ability to win back possession AND the composure to follow this up with a progressive event. Why win the ball back but then give it straight back to the opposition?”
Having looked at the data output around this facet of play, the coaching staff identified a trend across the second half data output around this progressive regain metric.
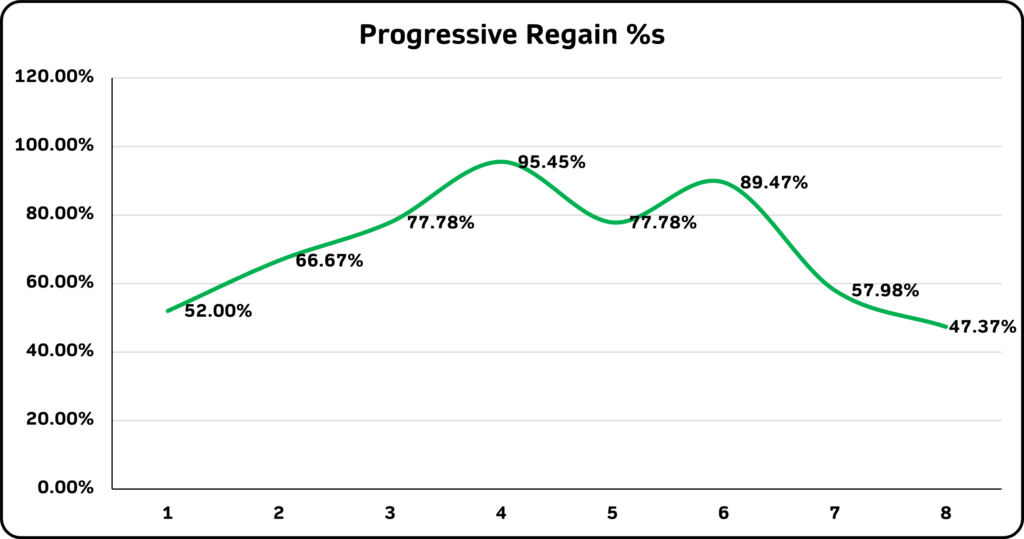
In several games, the second half output around this metric was noticeably lower than the first half output – with players being a bit more fatigued & concerned about the result, winning back possession & finding a fellow player was often secondary to clearing the danger first & foremost.
The two outliers in the graph below (Game 4 = 95.45% and Game 6 = 89.47%) were games where the U17 team were winning easily & in one case, were playing against ten players (due to a few injuries on the opp. Side). Other games’ outputs were scattered, with the management team able to identify the players who tended to lack composure more than most when regaining possession.
On speaking with the Technical Director at the end of this test period, he was pleased with the results:
“The players now have a far greater understanding about our belief in regaining possession & having the composure to find a teammate – transitioning from a defensive mindset into a progressive, attacking one. There’s plenty of work ahead for staff & players, but there is now an objective measure we can use to monitor how this on-field mantra is being heeded”.
Attacking Data Output
As mentioned, the coaching staff & Technical Director were keen to assess efforts on goal across the eight games – where they came from, how often key attacking players were involved in an effort on goal, and player shot efficiency percentages.
Efforts on Goal:
Through our “chance reporting”, we were able to break down the passage of play leading up to an effort on goal. The coaching staff were keen to see:
- How often certain identified players were involved in the build-up to an effort on goal?
- At what stage of the build-up certain players were involved and how often?
Through our unique Chance Report output, the coaching staff were able to pinpoint three particular players across the eight games & assess the stage of their involvement across each effort on goal.
Speaking to the U17 Head Coach, he said:
“We like to play predominantly & create through our #10 and both wingers – depending on particular tactics, we wanted to see which of these three was more prominent in which game. The data from the Chances Report was a massive tool for us in assessing when these players had their greatest impact & when they were quiet”.
Across the eight games, there were 59 chances on goal in total; peaking at 15 chances in one game with just four chances being the lowest total in another. By breaking down efforts on goal into headers, “foot” shots and blocked shots, the coaching staff were able to monitor player output in this area. There were two interesting findings from their perspective:
- The regular #8 central midfielder had a surprising number of headers on target. When analysing the clipped video footage, the player showed improved timing of runs. This was a major find by the coaching staff.
- The regular #11 was involved in the 3rd step before an effort on goal on only four occasions. The player had no higher involvement stage & this disappointed the coaching staff. This is a facet of the player’s development that they’ve now focused on.
When it came to shot efficiency (i.e. % of efforts on goal that are on target), attacking players had a poorer % output than thought. When I asked the coaching staff about this at the end of the test period, they had already introduced increased shooting drills into their weekly training schedule, the assistant Head Coach said:
“We believe that certain members of our playing roster should aim to be more clinical in front of goal & the shot efficiency output during the test period highlighted this. The players (and goalkeepers) are now enjoying extra shooting drills & we have added a competitive element to the drills which has added further enjoyment to training”.
At the end of our test period, our test club partner was particularly happy for a few reasons; mostly because access to their own player development data platform gave them an edge in preseason & has put their U17 team on a firm footing as they move towards more serious games in the coming months.
Through access to unique player performance data insights at U17 level, the coaching staff were able to objectively assess player performances in preseason & work closely with players on the training ground to work on facets of their game that may ultimately go untouched in preseason.
The Technical Director was able to access the data output from the same location & keep an overview on player performances & sit down with the coaching staff on player development plans that needed to be slightly amended. Having access to individual player reports, aggregated player data output & clipped video footage that can be saved in highlight reels, the opportunity to further enhance the players’ education & development was huge over the eight-game-period.
An added bonus for us at PlayerStat Data was the interest levels from an important stakeholder group that we were not expecting at this stage – the parents. Some parents were completely engrossed in their sons’ development at preseason & the objective, tangible data outputs that gave them a clear picture of the player’s progress over eight games.
Our 360° player development data platform will reimagine the way that a large number of clubs & academies deal with their players & their development pathways. Marrying five key facets of player development into one platform, clubs & academies will have access a level of insights at PlayerStat Data that are unavailable anywhere else.
Reach out to us at info@playerstatdata.com for further information – the opportunity is there for clubs & academies to fully power their players’ development pathways.
![]()
Leave a Reply
Your email address will not be published. Required fields are marked *