Possession Trends in the SSE Airtricity League Premier Division (Week 1-9)
Posted On May 01, 2024

Possession trends across the LOI Premier Division over the first 25% of the season. Accurate and intelligent data insights.
With a quarter of the season gone in the SSE Airtricity League Premier Division, now seems a good time for us to roll out some detailed summaries across chosen metrics. For our first series of summary blogs, we will detail team possession numbers and the playing styles that the numbers tend to describe.
Possession Overview
Over the 9 gameweeks, we have tagged just under 29,000 pass attempts. A huge number, with an average of 2899 passes per team. Taking both opposites (Waterford FC & Shamrock Rovers), there is a gaping difference in pass attempts – Rovers having over three times the number of successful pass attempts & well over twice the number of overall passing attempts than Waterford FC. It will not be a surprise to anyone to realise that Rovers are out in front, and to the Waterford watchers, the style of play under the previous regime wasn’t easy on the eye.
It is interesting to note that under Stephen O’Donnell, St. Pat’s are far more imposing in possession, second in successful passing attempts (3275) and overall attempts (3900). They beat possession-heavy Dundalk into third place across both measures.
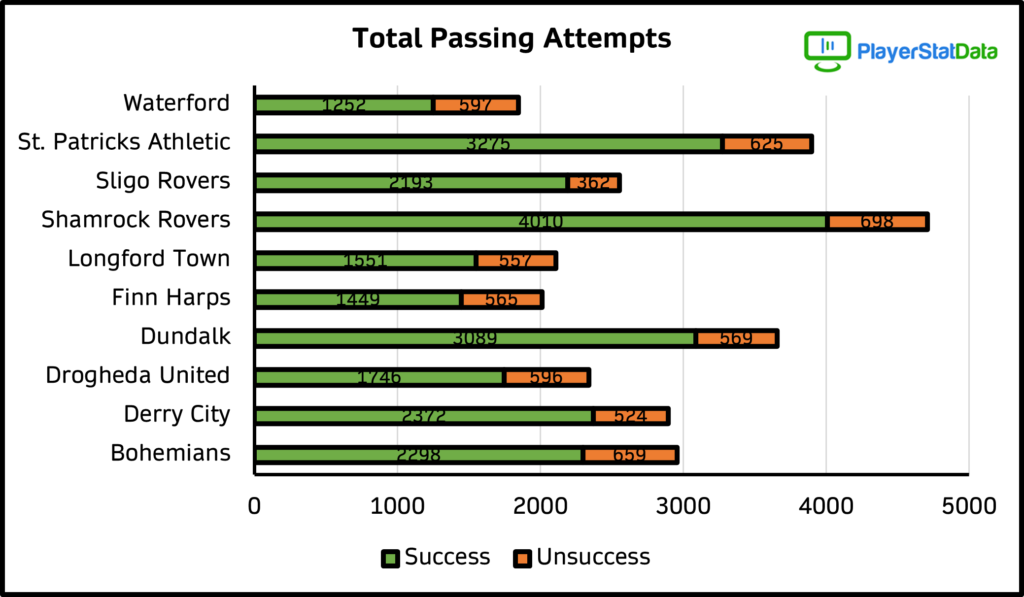
An interesting point of debate is the clubs with the highest/lowest number of unsuccessful passes. Shamrock Rovers have the highest number of unsuccessful attempts (698), but this is arguably due to their strong possession-style. Those sides that attempt to keep the ball for the longest amount of time are more likely prone to unsuccessful attempts. By proportion though, they have the 2nd lowest rate of unsuccessful attempts (14.83%) – Sligo Rovers have the lowest number of unsuccessful attempts (362, nearly 160 less than the next lowest) and the lowest rate of attempts (14.17%).
Where does your side rank in the basic pass completion rate table?
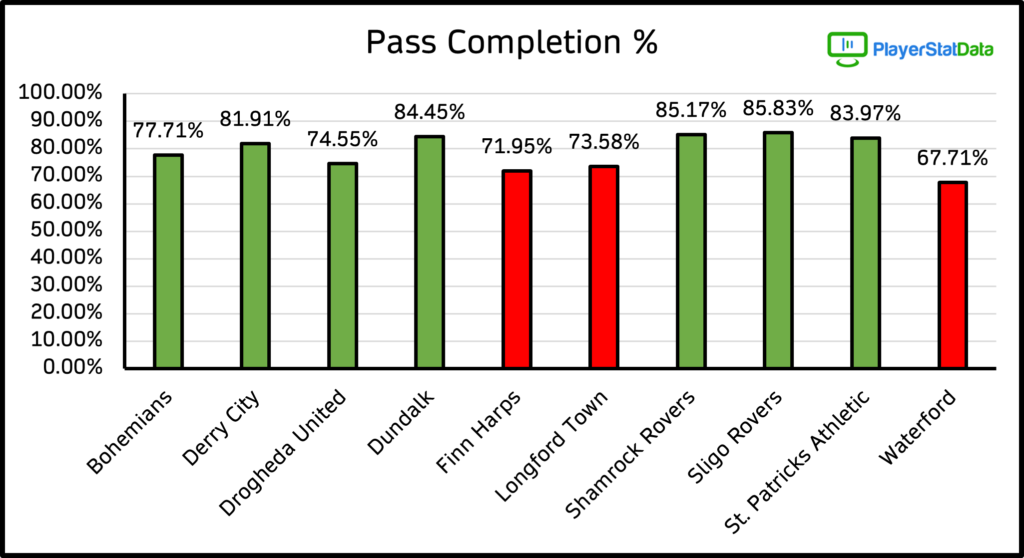
Pass completion %s are a useful tool to identify sides capable of maintaining possession better than others, but it is not without missing context – pass direction. A side with a low pass completion rate may, in fact, be attempting, riskier & more progressive passes more than the rest. On the other side of the coin, they may just be terrible in possession.
‘Unprogressive’ Possession
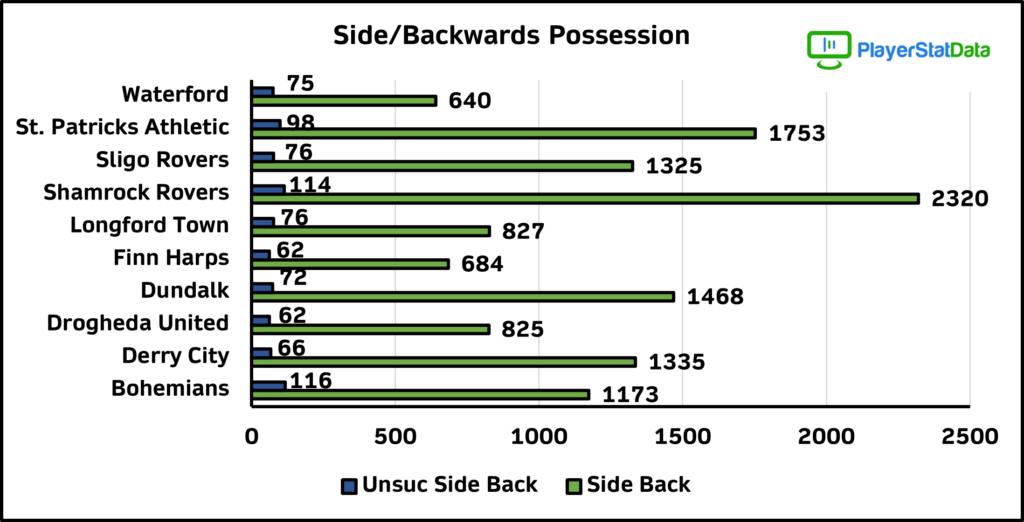
Sideways/Backwards passing attempts
Sideways/backwards possession is not necessarily a sign of an unadventurous side, lacking ideas – it may be maintaining possession as phases roll out, getting back into shape or running the clock down to hold what you already have. The graph above shows the trend likely to be witnessed throughout the coming visualisations, the better possession teams are in front across all directions. Here, Shamrock Rovers show the value in not always going forward with possession, with over 2400 pass attempts going in a sideways/backwards direction from the opposition goal.
As you would expect, there is a huge disparity between unsuccessful and successful passes in this category, with players expected (overall) to make these passes more often than not.
Progressive Possession
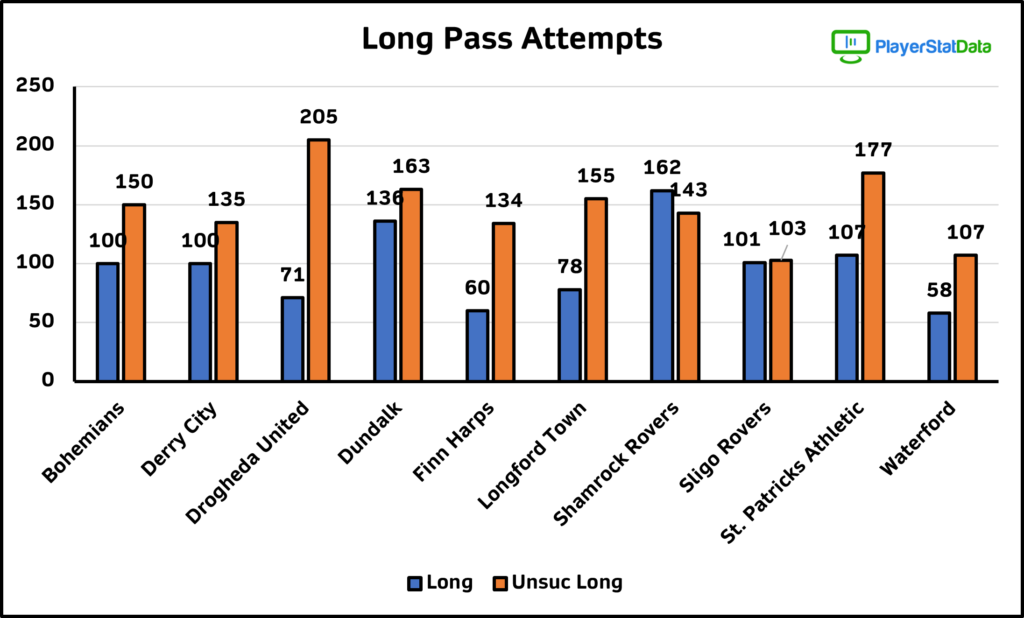
Long pass attempts
We start to see a disparity across ‘long’ pass attempts – those passes attempted that are 25m+ towards the opp. goal. It doesn’t have to be your stereotypical long-ball style hoof to be categorised as a long pass. Four teams stand out here for large disparities – Drogheda United, Finn Harps, St. Pat’s and Longford Town. Each of these sides has >70 pass difference between successful and unsuccessful attempts.
Shamrock Rovers and Sligo Rovers stand out once again in a positive sense – Shamrock Rovers having a greater # of successful long passes than unsuccessful & Sligo Rovers just under parity, with 2 unsucc passes the difference.
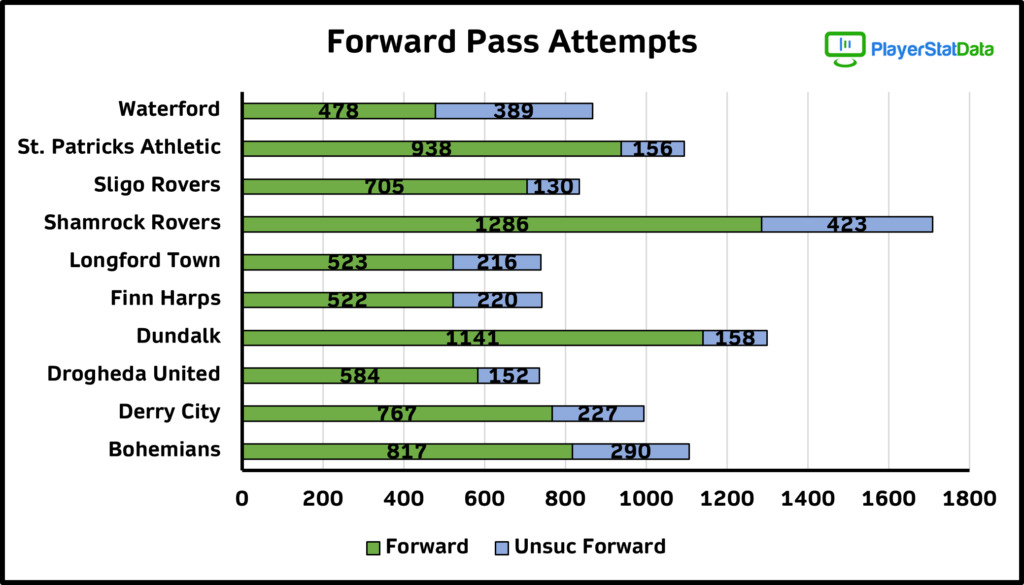
Forward Pass Attempts
When it comes to forward passes (i.e. those over a shorter distance with no opponent in the path of the pass), we see an interesting trend with Dundalk coming in ahead of St. Pat’s into 2nd place here. With the slower build-up play from Dundalk (maybe with injuries to key men such as Hoban & McMillan), Dundalk are forced to probe a bit more and be measured in possession. We have noticed a slight increase in the number of forward passes/90 at Dundalk in the last few games. Drogheda United, surprisingly, finish lowest in the metric (736), but with Finn Harps (742) and Longford Town (739) not too far ahead of them. As for Shamrock Rovers, with 1709 forward attempts, they are over 400 attempts ahead of the next best!!
Progr. Pass Attempts & Completion %
When factoring in penetrative passes (passes that break opposition lines) and through balls (balls directly through on goal with the attacker pre-empting or already making the move for the pass), we arrive at overall progressive passing %s. This gives us an idea of which sides tend to move the ball towards the opposition goal more than others and as a direct comparison, which sides are more successful in their attempts. We feel that these %s tends to give clearer insights into a side’s possession ability, as pass direction does not give a sense of direction/risk etc.
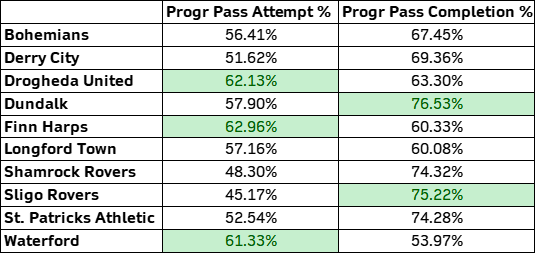
In this table, we highlighted sides who attempted more than 60% of their passes towards the opposition goal and then the sides who had a >75% success rate across these pass attempts.
Dundalk, St. Pat’s, Shamrock Rovers and Sligo Rovers are an interesting case here – Shamrock Rovers & Sligo Rovers rank as the sides with the lowest progr. pass attempt rate but are proficient when playing these passes while St. Pat’s and Dundalk play slightly more towards the opposition goal & end with a similar success rate ~75%.
An outlier here is Waterford FC – they rate highly in passes attempted towards the opposition goal, but then have the lowest success rate of all 10 sides.
Opposition Box Penetration
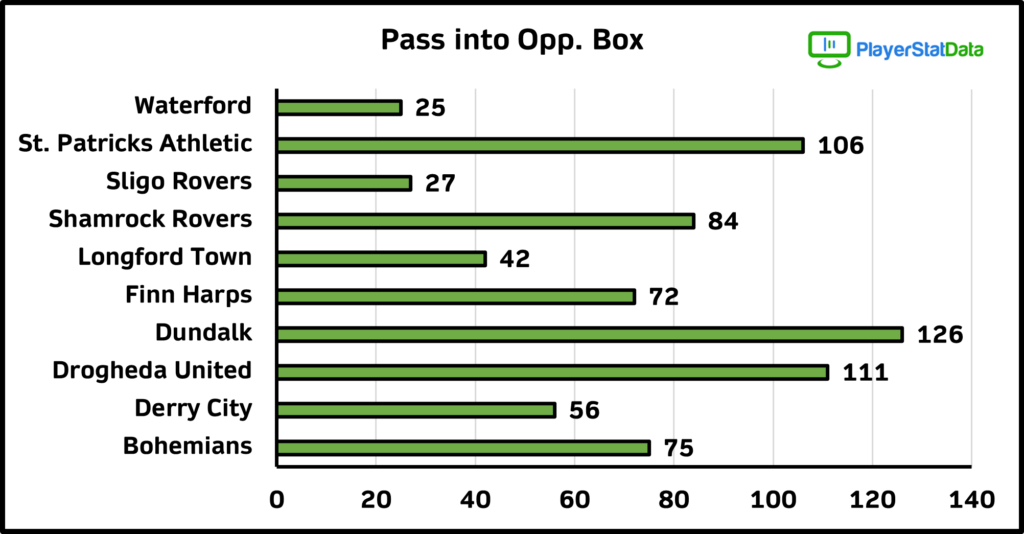
Our final chart is around pass attempts into the opposition box – a new metric for us this season, but one that strengthens the picture of a side’s effectiveness in possession. Please note, that this metric captures all attempts into the opposition box (i.e. both successful and unsuccessful). For us, the interesting outcome here is the fact that Shamrock Rovers are 4th for passes into the opp. box – what does this say about Rovers’ build-up style?
We carry the most accurate and intelligent data insights into possession in the SSE Airtricity League Premier Division; data that can be drilled further down into player output across the same metrics or broken down into players/ teams across first half and second half possession data.
We want to push the boundaries further and further in the League of Ireland (incorporate the WNL and First Division) and give players, clubs, fans and other stakeholders data with meaning, and most importantly, with trust and reliability.
Leave a Reply
Your email address will not be published. Required fields are marked *