Rise SC – MLS Next 2005: A brief performance data overview
Posted On May 01, 2024

In the first of our club-only series of player development data articles, we decided to look at MLS Next 2005 side Rise FC.

In the first of our club series of data articles, we decided to look at MLS Next 2005 side Rise FC over a short period of time. We collected individual player performance data on 2005 Rise FC players in three recent games:
v De Anza Force 05/17
v Strikers FC 05/15
v NY Red Bulls 05/14.
As in recent data articles, without team-sheets / lineup details available for our analysis team, we tagged by position only. This includes substitutions, so for the purpose of the article, the position’s (eg. ATT) total output covers any players who played in this position for Rise SC.
Across 2000+ individual player data points over the three games (defensive, possession & attacking based data output), there were some interesting outcomes. Bearing in mind it is a small sample set, we can still pull some insights out to highlight facets of the Rise SC 2005 performances in the three games tagged.
Attacking Data Output
The main takeaway from the attacking data output that we collected was a below average shot efficiency percentage (ie. the % of total efforts on goal that were on target).

As you can see from the table above, there was an overall % of 33.89% shot efficiency. Peaking at a high of 40% against NY Red Bulls, the side dropped down to around 30% efficiency over the other two games.
It is crucial to highlight the Att. Shot Blocked metric and the % of total shots blocked. 24.07% of efforts on goal were blocked by an opposition defender – we find this an important metric to collect as it gives greater context into the efforts on goal data. We believe blocked shots should be a stand-alone metric & not mixed in simply with on-target and off-target.
Let’s stretch this further and see whether there was a trend across the shot efficiency %s.
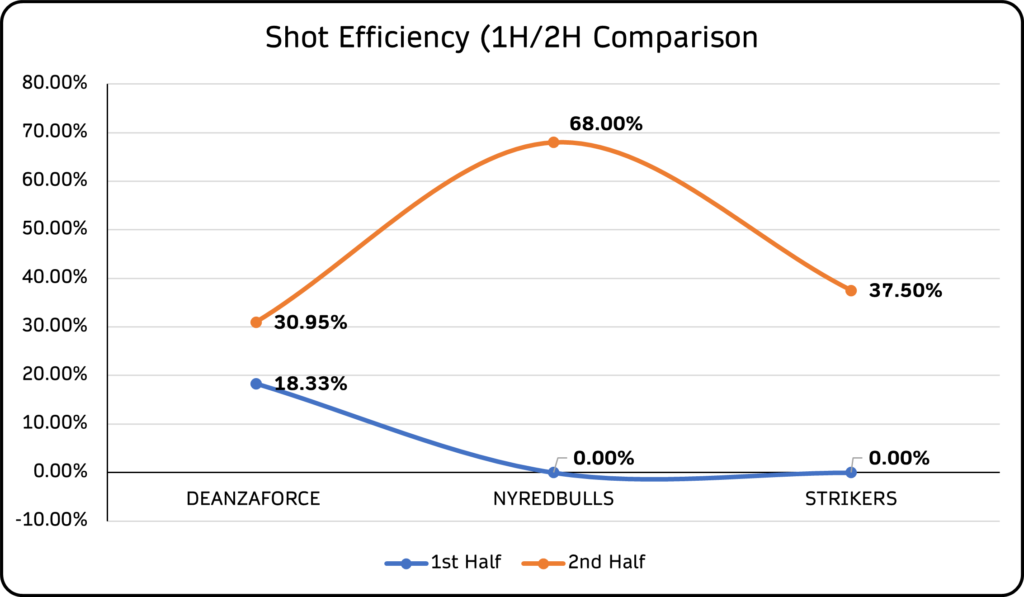
There was a marked improvement in 2nd half efficiency – with a high of 68% against NY Red Bulls. It is interesting to note that two of the three first halves played resulted in 0% shot efficiency output.
Possession Data Output
Our possession data insights are gaining traction across our articles. Our progressive possession insights are proving popular as it gives a much greater context & depth to the usual pass completion %s.
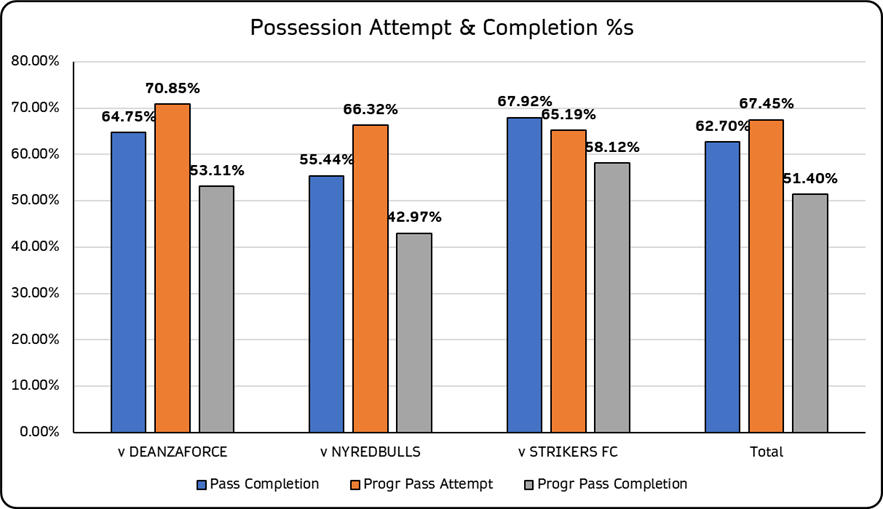
Pass Completion %s never got to 70%, which would be seen as the minimum bar for 2005s at this level. In many cases, this could be put down to factors such as player error etc., but it is interesting to note that progressive pass attempts were very high for this age group.
An average of 67.45% of progressive pass attempts is impressive – players willing to take more risks in possession & play less conservatively than other sides. The progressive completion rates were much lower (51.40%) but the trend in this side over the three tagged games were a strong willingness to find a teammate with a pass towards the opposition goal – and not a slow, patient sideways/backwards build-up.
What about pass direction?
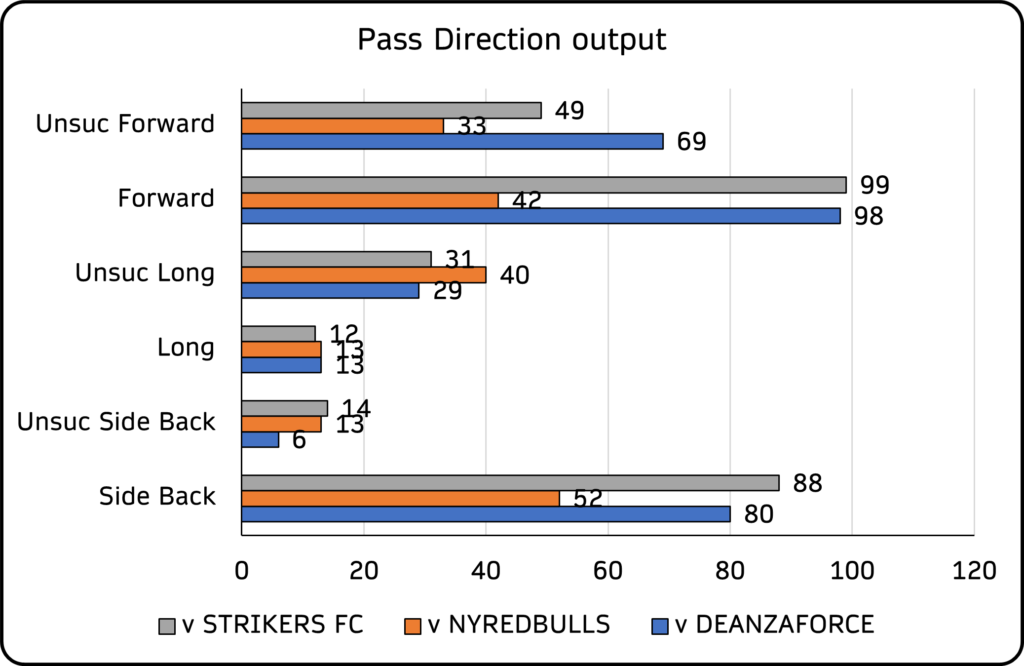
There were 390 forward pass attempts across the three games – nearly 140 more attempts than side/backwards. This is in marked contrast (positive) to some of the other MLS Next clubs we tagged in recent weeks.
Defensive Data Output
The final catch-all metric we will talk about in this article is one we introduced into a recent article – progressive regain %. The metric that shows off players’ ability to regain possession & follow it up with a positive action.
The key takeaway from these three games is that the Rise SC players are above average when it comes to this metric.
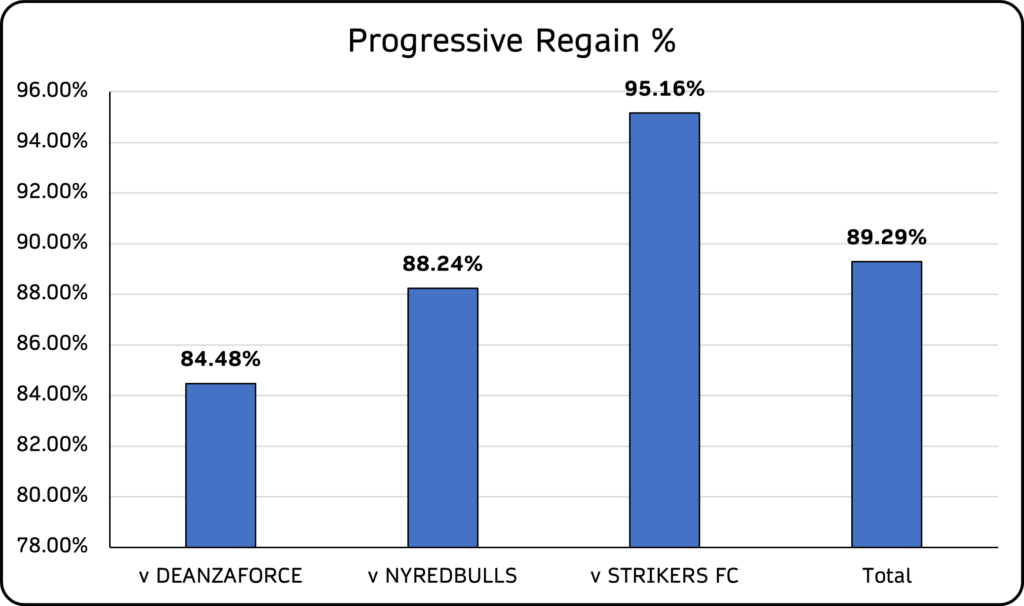
80+% would be seen as above-average in this metric, so the Rise SC staff will be happy with these data points – the Strikers FC game output is a very positive outlier. How does these %s breakdown when we look at loose ball recoveries & interceptions?
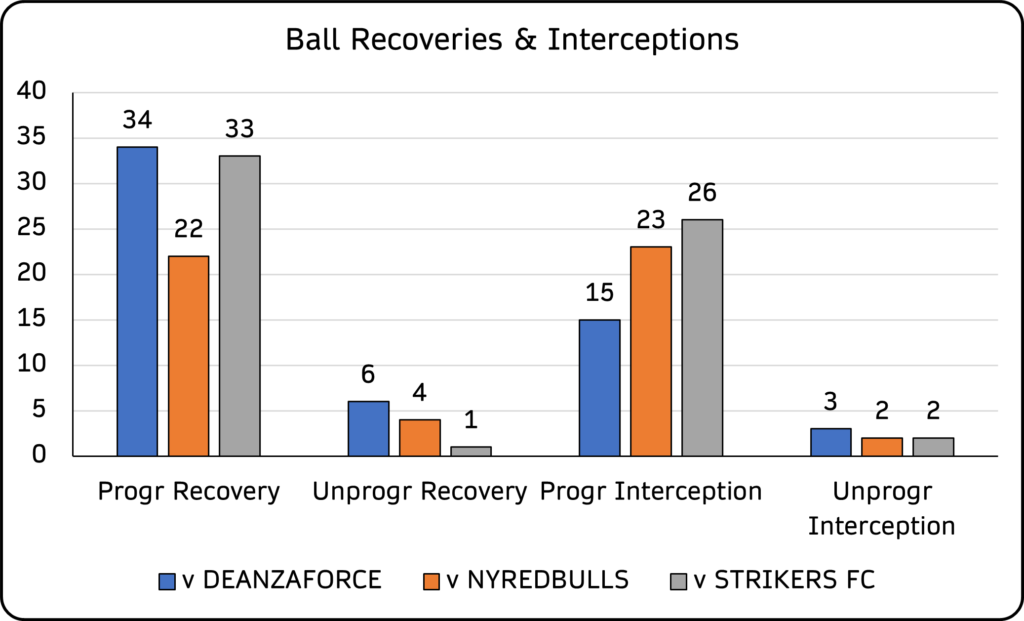
For us here at PlayerStat Data, the progressive interception output is very interesting & shows the Rise SC players in a very good light. Intercepting the opposition’s passes & following it up with a positive event. Fine reading of the game by the players & composure in possession to find a teammate after intercepting the pass.
We have a vast treasure trove of data output on these three Rise SC performances. This data is categorized across 64 metrics & available in 1H, 2H and 90 min formats. It can be broken down by team output & individual player performance data output.
At PlayerStat Data, our 360° Player Development data platform will reimagine & revolutionise the way soccer clubs & academies deal with their youth players’ development pathways. Marrying five key facets of player development into one platform, clubs & academies will access a level of insights at PlayerStat Data that is unavailable anywhere else.
Reach out to us at info@playerstatdata.com for further information – clubs & academies, enhance your own operations by fully powering their players’ development pathways.
Leave a Reply
Your email address will not be published. Required fields are marked *