Shelbourne 2020 End of Season Performance Data Review
Posted On May 01, 2024
In this article, we will take a deep dive into the performance data output from the players at Shelbourne this 2020 season.
A rollercoaster end to the season, where two wins in October made the club dream of Europe, but defeats in their last four games meant that they crashed out of the FAI Cup and lost a promotion/relegation playoff decider against Longford Town!
That said, there has been some excellent early business done, with Ian Morris boosting the squad on and off the pitch; he has been massively backed by the club – it could be a big 2021 for all at Shelbourne FC.
In this article, we will take a deep dive into the performance data output from the players at Shelbourne this 2020 season.
All stats highlighted are for players who played a min. of 270 league mins this season.

Goalkeeping
As mentioned in previous articles, our GK model is still under development. Colin McCabe and Jack Brady shared the jersey this season, both with ups and downs. A decent return between them of 6 clean sheets from 18 games – with 22 goals conceded in the remaining 12 games (1.83 goals per game, when conceding).
Defensive metrics
Def 1v1: Georgie Poynton led the rest of the squad when it came to defensive 1v1 situations/90 mins (definition in previous articles); with a very impressive 6.30 successful def. 1v1 situations per 90 mins. Gary Deegan was the overall team leader in number of def. 1v1 encounters however, resulting in 177 encounters – a long way ahead of Poynton in 2nd place (122). The player with the highest success rate (61.02%) was a player who featured less than most – Aidan Friel.
Notable mention for Jaze Kabia here though – a young, attacking wide player who was pretty dogged in winning back the ball for his team. He sat in 2nd place when it came to both def. 1v1 success rate (60.71%) and successful def. 1v1 situations/90 (6.12).
Tackles: Luke Byrne was a standout here, with the highest number of tackle attempts (20) and successful tackles/90 mins (1.33) over the season; a tackle being any sliding challenge made to dispossess an opponent. Again, Georgie Poynton ranks highly here with the highest tackle success rate (88.89%) from 9 tackles.
Def Aerial duels: Two players stand out here – Dan Byrne and Luke Byrne. Both centre halves contested the highest number of duels (70 & 77 respectively) and they both stand out from the rest in separate metrics. Dan Byrne had the highest number of successful duels/90 mins (4.54), highest number of successful duels (51) and the highest duel success rate % (72.86%). Luke Byrne comes in 2nd for successful duels/90 mins (4.08) and second highest number of successful duels (46).
Progressive Regains %: Our final metric for ranking the defensive side of the game is the progressive regain %. As mentioned in our previous article, it gives a greater sense of what a player does once possession is regained. Three players stood out here in this metric (min. 20 attempts required): Daniel O’Reilly, Luke Byrne, and Denzil Fernandes. O’Reilly led the way with a 91.84% regain success rate, Byrne second with 87.64% and Fernandes third with 83.33%.
Notable mention for Gary Deegan, the highest number of progressive interceptions (52) and progressive recoveries (155) over the season, leading to 254 individual regain attempts – the next closest was 115 from Sean Quinn. Huge ball recovery efforts from Deegan.
On the two final metrics, blocked shots, and blocked crosses, two players again stood out greatly from the rest: Daniel O’Reilly (11 blocked shots) and Georgie Poynton (11 blocked crosses).
Attacking Metrics
Goal Scoring: Shelbourne scored 13 goals this season (second lowest in the League), from just 144 efforts on goal. Based on shot location only, their total season xG was 21.08 goals. A pretty high under-performance in front of goal. Ryan Brennan and Gary Deegan were the top scorers with 3 goals each, but they also led the way in outscoring their xG totals. Brennan over-performed in front of goal by 0.82 goals and Deegan’s over-performance was massive: 2.1 goals scored than his xG total.
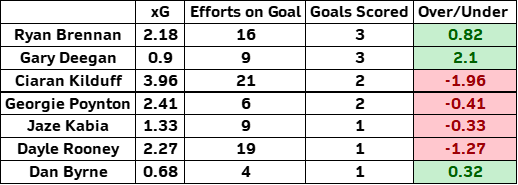
Ciaran Kilduff and Aaron Dobbs led the way around efforts on goal; Dobbs finishing the season with the highest number of efforts on goal/90 (0.48 efforts per game) and Kilduff ended the season with 23 efforts on goal; 2 goals from these efforts.
Chances Created: The ‘chance creator’ is powerless as to whether it is an assist or not (down to his teammates’ ability to finish), but using chances created as a metric, this gives a clear indication of who the creative influences in the side are. Dayle Rooney was Shels’ most creative player this season with 1.80 chances created/90 mins, also leading the way in number of chances created [23]). Georgie Poynton was second for both the number of chances created (14) and chances created/90 (1.36).
Attacking Aerial Duels & Hold Up: In previous articles, the same player (usually the target man up front) led the way in both metrics; apart from at Sligo Rovers. Ciaran Kilduff was #1 in both overall datasets. A successful attacking aerial duels/90 min rate of 5..15, highest number of duels (168) which was 101 more than his nearest rival at the club. Kilduff was also the squad leader for the number of successful hold-ups/90 mins (1.93) and close to three times more hold-up efforts (36) than the next nearest player.
Attacking 1v1 & Dribbles: Denzil Fernandes and Jaze Kabia led the way in the attacking 1v1 situations here, Kabia ending the season with the highest number of take-on attempts in the squad (efforts to beat the opposition defender). Fernandes led the way in successful att. 1v1v attempts/90 (1.86) with Kabia in second with 1.62 attempts per 90.
Notable mention for Georgie Poynton, who ended the season with 100% att. 1v1 success rate from 10 attempts to beat the defender in front of him. An interesting, standout statistic in the Shels’ dataset.
Alex O’Hanlon (17) is an interesting leader in the dribble metric, with three more dribbles completed over the season, ahead of Fernandes and Sean Quinn in joint 2nd with 14.
Possession Metrics
4441 passing attempts were tagged for Shelbourne this season (both successful and unsuccessful). With regards to pass direction:

Who stood out, possession-wise? Pass completion doesn’t always give the clearest indication of passing value, due to lack of directional data. Gary Deegan ended with the highest pass completion rate (88.01%) from by over 300 attepmts, the highest number of pass attempts (659). He had the highest number of successful passes/90 mins (32.71) & the highest number of successful passes overall (580).
Again, in our previous articles, we mentioned that progressive passes are a far more insightful possession metric; passes towards the opposition goal. Dan Byrne leads this metric with 75.16%% of his passes made towards the opponent’s goal. Byrne was not the player with the greatest progressive accuracy, however. Gary Deegan stands out again with a progressive pass completion rate of 78.13%, just ahead of Luke Byrne with 76.50%.
Player of the Season: Our data collection is completely objective; no opinion, no punditry and no “should have done better there”.
Due to consistency across the entire season, we have gone with Gary Deegan as the main standout figure for Shels this season, and name him our Player of the Season from a statistical output point of view.
The player was joint top goalscorer, massively outperforming his xG total. He was way ahead of his teammates in possession and very consistent across defensive metrics.
I think it is safe to say that Georgie Poynton pushed him close – with standout data output across defensive and attacking metrics. The overall feeling here, at PlayerStat Data, is that Deegan outshone more across a wider range of performance data sets!!

Leave a Reply
Your email address will not be published. Required fields are marked *