Bohemians FC Performance Data Review – 2020 Premier Division
Posted On May 01, 2024

Bryson DeChambeau embraces innovation & bespoke performance data analysis to push his limits. League of Ireland soccer players are now able to access tools to drive their own performances through bespoke data outputs
In this article, we will take a deep dive into the Premier Division performance data output from the players at Bohs this 2020 season.
All stats highlighted are for players who played a min. of 270 league mins this season.

Goalkeeping
As mentioned in previous articles, our GK model is still under development. James Talbot and Stephen McGuinness shared the jersey this season; both solid goalkeepers and we thought that Talbot was very impressive coming back into the side just after the restart in July. A decent return between them of 9 clean sheets from 18 games – with 12 goals conceded in the 9 games (1.33 goals per game, when conceding).
Defensive metrics
Def 1v1: Michael Barker led the rest of the squad when it came to defensive 1v1 situations/90 mins (definition in previous articles); with a very impressive 7.07 successful def. 1v1 situations per 90 mins. Keith Buckley was the overall team leader in number of def. 1v1 encounters however with 184 encounters – a full 84 encounters ahead of Andy Lyons in 2nd place. The player with the highest success rate (67.14%) – Rob Cornwall.
Tackles: Michael Barker again stood out here, with the highest successful tackles/90 mins (0.94) over the season; a tackle being any sliding challenge made to dispossess an opponent. Interestingly, Kris Twardek had the number of tackle attempts (4 number of tackle attempts (17) & highest number of tackle successes (11). Again, Rob Cornwall ranks highly here with the highest tackle success rate (83.33%).
Def Aerial duels: One clear standout player in this metric – Dan Casey. The player ended the season with the highest number of duels contested (66), the highest number of successful duels/90 mins (3.07), the highest number of successful duels (46) AND the highest aerial success rate (69.70%).
Progressive Regains %: Our final metric for ranking the defensive side of the game is the progressive regain %. As mentioned in our previous article, it gives a greater sense of what a player does once possession is regained. Paddy Kirk led the way here with a 87.50% progressive regain rate from 40 regain attempts.
Notable mention for Keith Buckley with the highest number of progressive interceptions (42) and progressive recoveries (136) over the season, leading to a total of 234 individual regain attempts – the next closest was 151 from Dan Casey.
Attacking Metrics
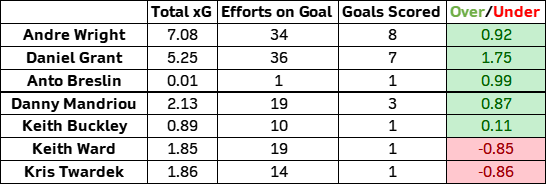
Goal Scoring: Bohs scored 23 goals this season from just 219 efforts on goal. Based on shot location only, their total season xG was 29.88 goals – under-performing in front of goal by 6.88 goals. Andre Wright was the top scorer with 8 goals, outperforming his xG rate (7.08 goals). Danny Grant also outperformed his xG total by 1.75 goals, an impressive strike-rate in front of goal. The most efficient in front of goal (i.e., the player with the highest efforts on target ratio) was Keith Ward with a 50% efficiency %.

Chances Created: The ‘chance creator’ is powerless as to whether it is an assist or not (down to his teammates’ ability to finish), but using chances created as a metric, this gives a clear indication of who the creative influences in the side are. Dawson Devoy was the most creative player this season with 3.09 chances created/90 mins, from 18 chances created – second highest in the squad. Danny Grant led the way here though, creating 20 chances in total.
Attacking Aerial Duels & Hold Up: In previous articles, the same players led the way in both metrics. The same applies here with Andre Wright. A successful attacking aerial duels/90 min rate of 4.85, highest number of duels (157) which was 91 more than his nearest rival at the club. Wright was also the squad leader for the number of successful hold-ups/90 mins (3.86) and over five times more hold-up efforts (66) than the next nearest player.
Attacking 1v1 & Dribbles: Danny Grant stood out from the rest in both metrics – the player ended with the most dribble attempts (53), joint-highest number of take-on attempts (61) in the squad (efforts to beat the opposition defender) AND successful att. 1v1 attempts/90 (2.77).
Possession Metrics
4994 passing attempts were tagged for Bohs this season (both successful and unsuccessful). With regards to pass direction:

Who stood out, possession-wise? As mentioned in previous aticles, pass completion doesn’t always give the clearest indication of passing value, due to lack of directional data. Dawson Devoy ended with the highest pass completion rate (83.70%) from 184 pass attempts. Keith Buckley completed the highest number of successful passes/90 mins (31.37), the most successful passes (513) & the highest number of pass attempts overall (625).
In previous articles, we mentioned that progressive passes are a far more insightful possession metric; passes towards the opposition goal. James Finnerty leads this metric with 78.83% of his passes made towards the opponent’s goal. The same player also had the greatest progressive accuracy, with a progressive pass completion rate of 78.70%, ahead of second-placed Dan Casey with 77.36%.
Leave a Reply
Your email address will not be published. Required fields are marked *