Dundalk FC – Player Performance Output Update
Posted On May 01, 2024
A deep-dive into Dundalk FC player performance data output across the early stages of the 2021 season. Driven by accurate & intelligent performance data output.
This season, so far, has been one of ups and downs for Dundalk. Beating Shamrock Rovers to the President’s Cup, followed by domination across some games, not reflected in their points tally (up to Week 6) & another managerial change at the club. Whereas the results tend to grab the spotlight, there are a few players who have been performing well overall. In this blog, we will highlight some of those who stood out across the first 6 game weeks for Dundalk and could point to a mini revival in the coming 6 weeks.
*Performance data output up to, and including, the 1-1 draw against Derry City on 20/04.
**Players highlighted have played a minimum of 270 mins.
Defensive Performance Output
In this section, we will highlight players’ defensive output across the following catch-all metrics: Progressive Regain %, Standing Tackle/Challenge Success %, Ground Tackle Success %, Def. Aerial Duel Success %, while highlighting those players who tend to clear the ball from immediate danger in their own 18 yard box.
For us, progressive regain %s tells us the players can recover loose balls or intercept an opposition pass, but then they follow it up with their own positive action (keeping possession/gaining territory, winning a set piece etc.). It isn’t surprising to see the usual defensive suspects driving this metric forward, with Chris Shields involved in 101 recovery/interception events across 6 games (71 recovery events & 30 interception events – both successful & unsuccessful). His success % may not be as high as Andy Boyle or Daniel Cleary, but the sheer volume of regain events weighs in his favour. Three players who stood out in regaining possession & following it up with a beneficial event for their team:
| Total Recoveries | Total Interceptions | Progr Regain % | |
| Andy Boyle | 52 | 6 | 82.76% |
| Daniel Cleary | 61 | 9 | 78.57% |
| Chris Shields | 71 | 30 | 78.22% |
With regards to Def. 1v1/standing challenges, this is an important defensive metric – winning the ball back/forcing dispossession whilst staying on their feet. Many defenders comment that going to ground is often the act of a desperate defender. An interesting outcome over the first 6 games was that Cameron Dummigan stood out amongst everyone else in this metric – involved in 86 standing challenges and winning 60.47% of these. He has been one of Dundalk’s better players in winning back possession and his standout success here is just one such indication of this.
Regarding going-to-ground to win back possession, there are some interesting outcomes also. Chris Shields and Raivis Jurkovskis lead the way here, both with 7 sliding tackle attempts over the 6 games – neither player have more than a 60% success rate in these. Two players stand out with a 100% success rate of regaining possession/dispossessing the opposition player when going to ground: Dummigan and Andy Boyle.
The final comparison across success %s is def. aerial duels – winning the ball in the air while under pressure from an opposition player. From a sheer success % here, Jurkovskis leads the way with 80% success rate from 10 duels. The two centre halves stand out in attempts however, with Andy Boyle taking part in 26 aerial duels (69.23% success) but Daniel Cleary way out in front with 39 duels (58.97% success rate). This domination by both players is also shown in headed clearances (i.e. clearing the ball from danger using their head & not under immediate physical pressure from the opposition) – Cleary with 32 clearances and Boyle with 20.
The final defensive metric that we want to highlight are “own-box” clearances: i.e. clearing the ball away from danger from within your box. This is a new metric of ours and tends to highlight the more ‘important’ clearances, those of pressing concern. Once again, the same two suspects are standing out here, Boyle and Cleary, with 16 and 15 own box clearances, respectively. It gives a little bit more context to the # of clearances per player in each game – with those inside their own box having its own pressing importance.
Attacking Performance Output
In this facet of player performance, we will highlight those who stand out across att. 1v1 success %, efforts on goal, shot efficiency and chances created.
We define att. 1v1 success as those events where a player in possession, essentially, beats the opposition player in an attacking 1v1 situation. Considering the way Dundalk approach games & who tends to get the space, the outcomes are intriguing. Those with the highest success %s are not the attacking types, but those players highlighted in the defensive piece – Andy Boyle (100% success, 5 attempts), Chris Shields (100%, 12 attempts), Cameron Dummigan (93.33%, 15 attempts) and Daniel Cleary (92.86%, 14 attempts). An interesting performance output statistic to back this up is that Daniel Cleary is out in front with the highest # of dribbles too (a trend we are seeing more of: defenders running the ball out from the back and exploiting space in front of them).
With the nitty gritty at the other end of the pitch, creating chances and efforts on goal, there aren’t as many surprises as the dribbles/beating players metric above. Patrick Hoban and Michael Duffy stand out here – Hoban with 17 efforts on goal and Duffy with 15. We break down efforts into headers (on/off target), “foot” shots (on/off target) and att. shots blocked. We find this final metric is a good differentiator, it may not have reached the goalline in any sense, but it puts a bit more context into a player’s efforts to have an attempt on target.
When comparing the shot efficiency of both players, there is little to choose between them too. Hoban slightly out in front with 35.29% shot efficiency (i.e. the number of efforts on goal on target, compared to the total number of player’s efforts on goal), with Duffy coming in with 33.33% shot efficiency. The highest shot efficiency % was in fact for Sam Stanton (66.67%), but with just 3 efforts on goal, this is seen as an outlier.
The likes of goals and assists are there for all to see, but at PlayerStat Data, we put a greater emphasis on chances created. We feel that the assist statistic can be misleading, as a player’s assist output is dependent on teammates finishing the chances put in front of them. A simple chance creation stat shows a player’s creativity range a lot better than assists (i.e. capturing all shots created and not just those that are scored). Due to several factors (main set piece taker, creator-in-chief from wide areas), Michael Duffy is way ahead with 16 chances created over the 6 games; a long, long way ahead of Hoban and Dummigan in joint 2nd place with 5 chances created.
Possession Performance Output
Finally, possession – what do players do in possession and who are the progressive passers in the team. As mentioned in previous blogs last season, we do collect pass completion % data, but like assists, it only tells part of a story. We look to delve deeper into the numbers and assess who are the players that are progressive in their passing – looking to pass towards the opposition goal & break opposition lines.
The table below gives an idea of what this select group of players was doing in possession:
| Successful Pass Attempts | Pass Completion | Progr. Pass Attempt % | Progr. Pass Completion % | |
| Andy Boyle | 274 | 95.47% | 65.85% | 93.12% |
| Daniel Cleary | 299 | 82.83% | 68.14% | 76.02% |
| Chris Shields | 279 | 82.30% | 61.06% | 72.95% |
| Raivis Jurkovskis | 105 | 78.95% | 73.68% | 72.45% |
| Michael Duffy | 154 | 86.03% | 44.13% | 72.15% |
| Cameron Dummigan | 174 | 82.08% | 59.43% | 70.63% |
| Sam Stanton | 110 | 79.71% | 57.97% | 68.75% |
| Patrick Hoban | 75 | 69.44% | 46.30% | 46.00% |
Again, with the way teams tended to play against Dundalk, the more defensive players found themselves in possession more than players towards the other end of the field (a more common trend across the Premier Division teams than not). Andy Boyle with a huge 95.47% pass success rate – this is then given greater context but identifying that just over 65% of his pass attempts were towards the opponent’s goal and just over 93% of these attempts were successful. These two final metrics give a greater clarity to a player’s possession output, whereas simple pass completion data gives no indication of pass direction or nature of passing ‘risk’. An interesting side note from this table is that Patrick Hoban has been involved in just under 14 pass attempts per 90 mins.
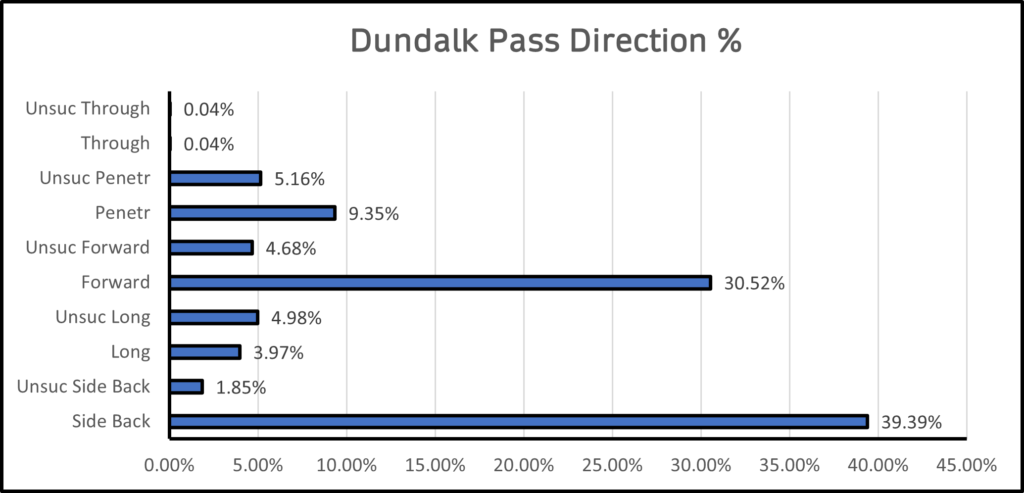
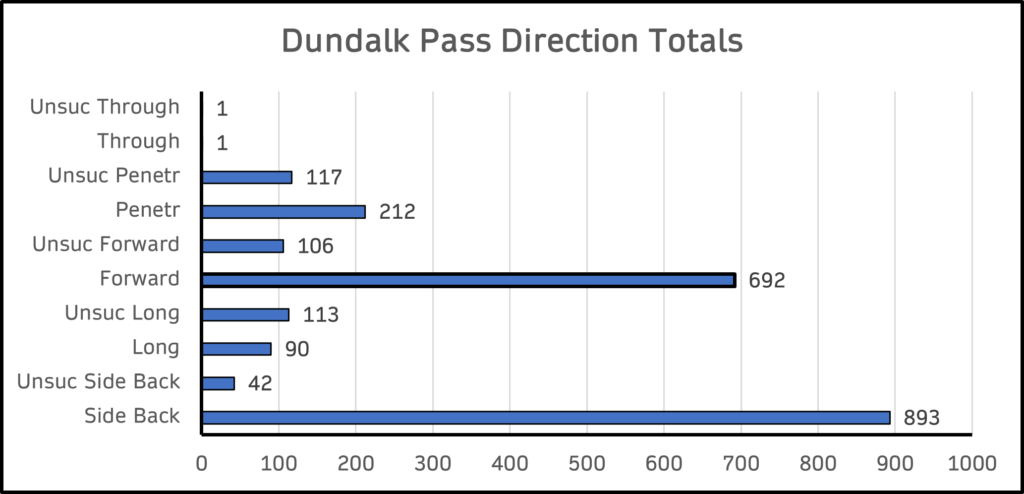
A final treat for those looking for a bit more context into Dundalk’s possession output – pass direction. Where is the ball going and how progressive have the Dundalk players been in possession, on the whole?
Leave a Reply
Your email address will not be published. Required fields are marked *