LOI Premier Division Player Position Possession Data Trends (so far)
Posted On May 01, 2024
A detailed blogpost on the possession trends by position in the LOI Premier Division over the first 11 game weeks.
In this article, we will look at possession trends by position across the LOI Premier Division over the first 11 gameweeks. What positions tend to be dominant in possession, where are the riskier/progressive passes played from etc.? What insights can we get from styles of play?
Successful Pass Attempts per position
In this first graph, we compare the % of successful passes per position, compared to the overall success % – over the first 11 gameweeks, our team tagged a total of 28,402 successful passes across 15 outfield positions.
Here is the success % breakdown:
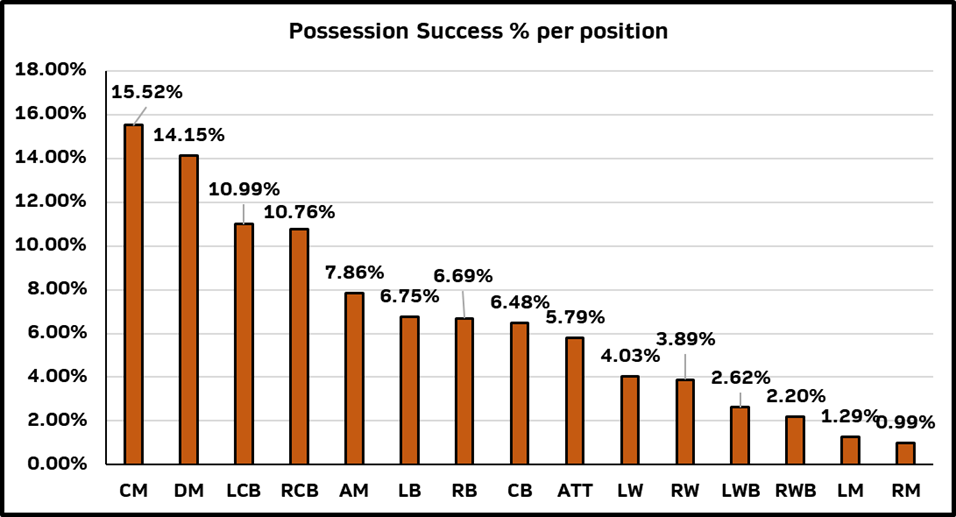
Interestingly the top 5 positions in this graphic represent a more central approach to possession (59.72% in total across the positions). Over the 54 games tagged so far this season, it has been noticeable how much possession has been central in nature, particularly with increasing time on the ball for centre halves. This graph may point to another trend in the possession build-up – maintaining the ball in a central role before switching it wide.
Where the first 5 positions in our graph are central, the final 6 positions are in wide areas but with a much lower successful possession rate (just 15.02% in total across the positions) – is this a case of teams getting the ball wide for that one attempt to get the ball into the box or are wide players simply guilty of being wasteful in possession?
Total Pass Attempts per position
How does this compare with the total number of overall pass attempts per position? Will we see the same format of positions when it comes to total pass attempts (35,315 total pass attempts)?
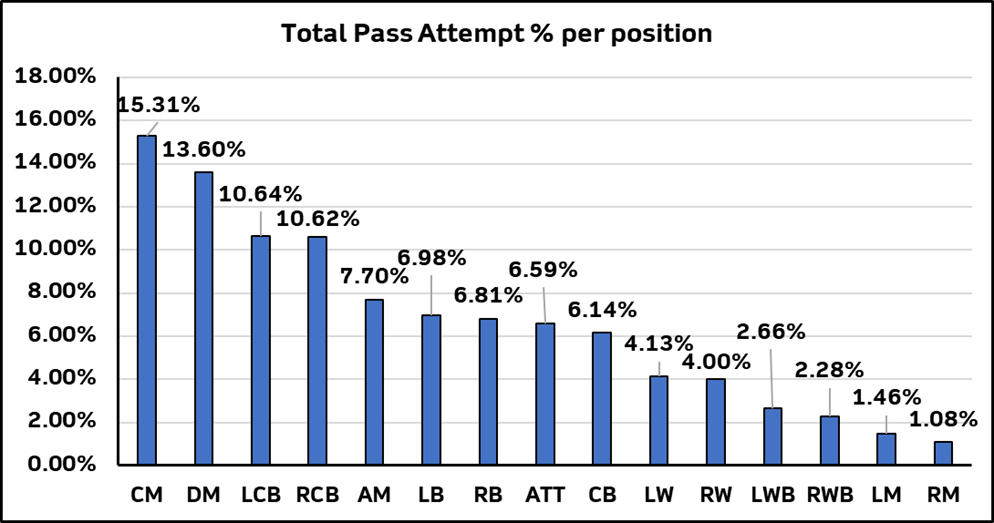
In short yes, the only slight difference is a switch between ATT and CB but that is a minimal change. 57.86% of all pass attempts came from players playing in central roles with the lowest 6 positions in this graph contributing a total of 15.61% of all pass attempts.
We understand that the players may not have been in these exact “position locations” when in possession each time (i.e., the AM may be in possession in the LB position) but it is a strong indication of which players get on the ball more often in certain systems.
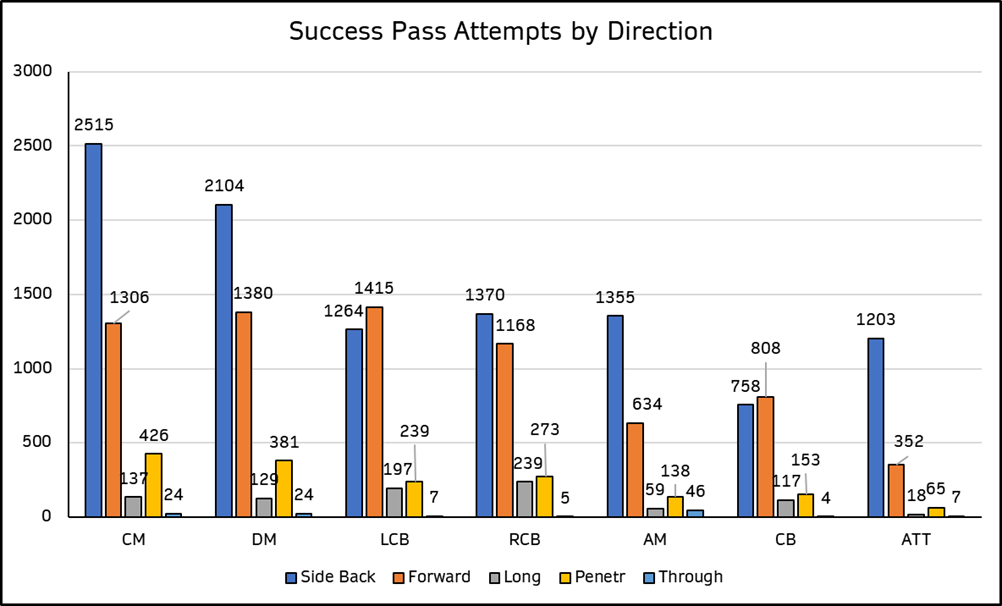
Pass Direction per ‘central’ position
A busier graph here, we give a breakdown of successful pass attempts by direction – using the “central” positions first. Interestingly, the three centre-half/sweeper roles are the only positions that played more progressive, successful passes than sideways/backwards passes. The ATT role, by its nature, is more likely to be less progressive in possession (link-up play, laying it off) but the three midfield roles are far less progressive in possession than you’d expect.
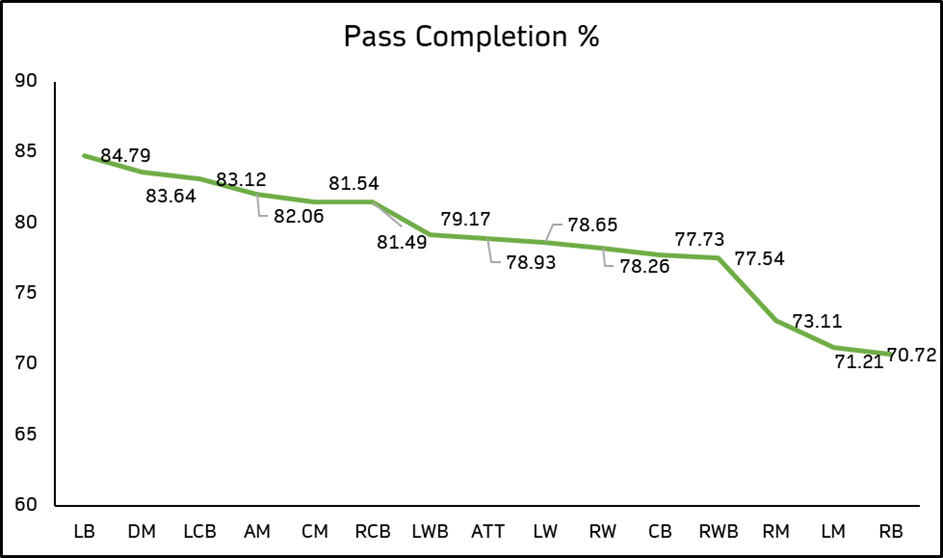
Pass Completion %
Pass completion % is a decent metric for a player’s ability in possession, without giving further insights into the direction/riskiness of their pass attempts. It does, however, give a decent overview of a player’s ability in possession – but which positions tend to have the greater pass completion rates? And how does the format of positions compare with the progressive pass completion % per position?
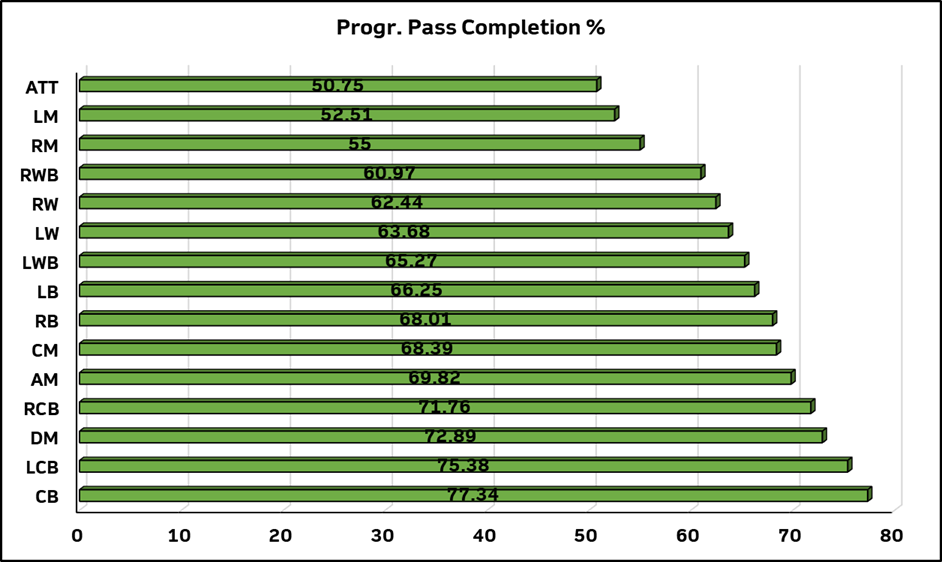
Progressive Pass Completion refers to the completed pass attempts that are made towards an opposition goal – giving greater insight into a player/position’s willingness to drive possession forward.
Pass into Opposition Box
The final comparison by position we will create is around pass attempts into the opposition box – this metric counts the attempt into the box, whether the pass is successful or not. It gives an indication as to which players look to get the ball to a teammate’s feet/into space more often, in a dangerous position.
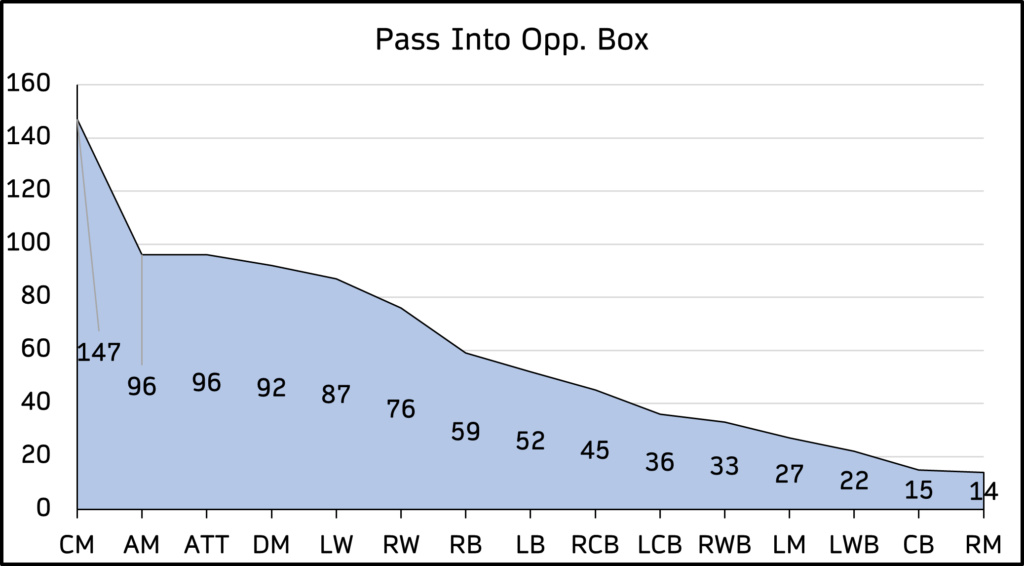
Unsurprisingly, the top 6 in this graphic are positions where you would expect to see a more progressive emphasis on possession into the opposition box – the scale of the difference between CMs and the rest is surprising however.
For those who reached out after previous blogs, crosses do not count as a pass into the box (for us anyway). Whatever a reader’s views may be on crosses, at PlayerStat Data we have those as a stand-alone attacking metric and not a possession metric.
Leave a Reply
Your email address will not be published. Required fields are marked *