MLS Next 2005 – Player Development Blog
Posted On May 01, 2024
In our next Player Development data blogpost, we decided to take another two MLS Next 2005 games in the recent past.

In our next Player Development data blogpost, we decided to take another two MLS Next 2005 games in the recent past & collect performance data on each player across the two games. The games we looked at were:
- Bethesda SC v Springfield SYC 04/23
- Met Oval SC v BW Gottschee Academy 04/23
To further showcase the data output that we collect across 1H, 2H and 90 min totals, we decided to include some defensive data insights in this blog – namely possession recovery & retention. Just under 3500 individual player data points were collected across the four teams.
Note: The data insights collected here are collected by position due to no lineup/substitution details. Data was collected on 64 individual player performance metrics and is categorized & available in 1H, 2H and 90 min totals.
Progressive Regain
Loose ball recoveries & interceptions can tell a lot about a player’s reading of the game & efficiency. Being in the right place at the right time to recover a loose ball or cutting out a potentially damaging pass for the opponents.
18 months ago, we looked at how we could develop this further – how can we give the clients a greater insight into a player’s ability in recovering possession?
Firstly, we developed progressive & ‘unprogressive’ recoveries and interceptions. This assessed whether a player follows up the recovery/interception with a positive action. A simple count of a player’s 7 interceptions in a game gives no further detail into what happened post-interception.
To extend the reach of this metric, we then created “Possession Regain” – the % of occasions a player recovers a loose ball or intercepts an opponent’s pass & follows up with a positive action.

With this being a 2005 group, the rate of recovery & interception is not that surprising. Springfield SYC and BW Gottschee’s rate of intercepting passes is pretty extraordinary across their performance. How does this excellent interception rate relate to their overall regain rate?
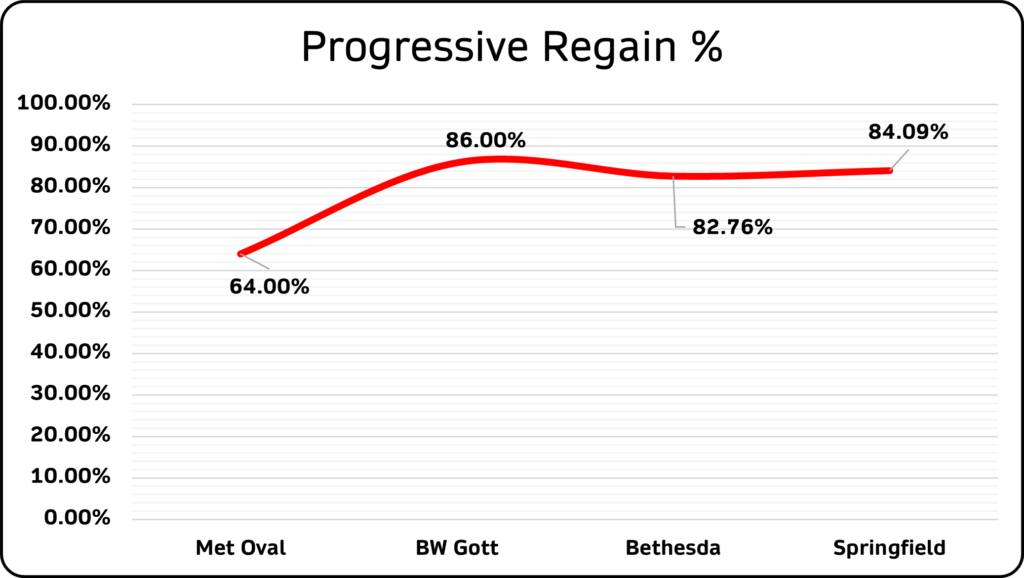
As you can see from the chart, there is a huge gulf between Met Oval’s performance & the other three teams. 82%-86% regain is above average when compared to all other teams tagged across our database, with 64% being below average. It must be remembered that this is just one game for each side & should be taken in that context.
Another team aspect that we wanted to highlight is pretty minor but an interesting one to assess – deterring danger. How effective is a team at cutting out the danger from efforts on goal & crosses?
When it comes to efforts on goal, many can get missed if they are neither on nor off target. Blocking an effort on goal before it makes its way to the goalkeeper is an aspect of a defence’s game that is often under-appreciated – with just the showstopping blocks making any highlight reels.
The same can be said about blocking crosses from becoming a danger inside their penalty area. Another often under-rated part of a defensive performance is cutting out a cross before it gets into the danger area. How did each team do in both “deterring” capacities in their performances?

Possession Output
A favourite output from our recent blogs is the pass direction output of each team that we collect data on. How progressive/conservative are they in possession?
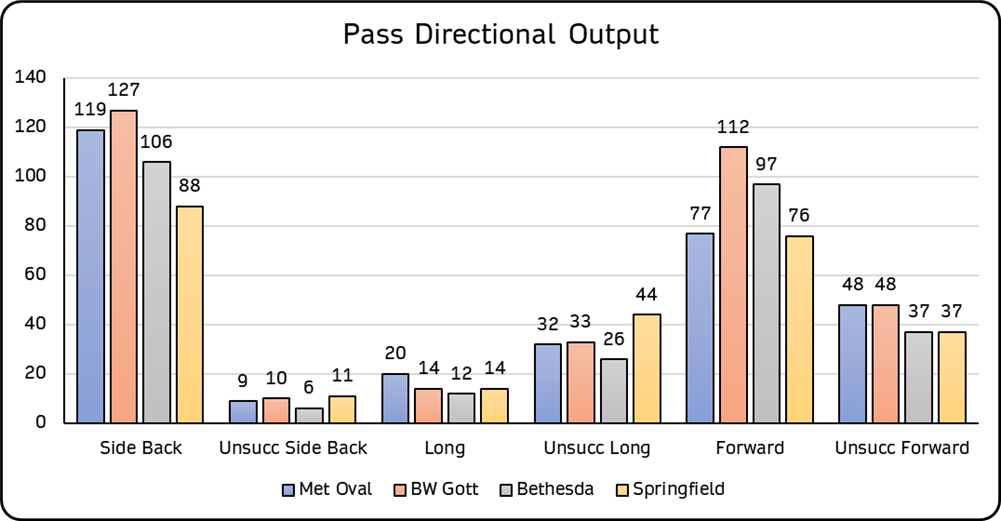
The output here is very interesting from our own point of view – it is rare to see a group of teams as similar in output (apart from the BW Gottschee forward pass output). There is a noticeable outcome here from a Met Oval point of view – the gap between the total of side/backwards pass attempts & forward pass attempts.
In this, there are 42 more passes in a side/back direction for the Met Oval 2005’s, compared to those in a forward direction. This is not highlighted as a bad thing however – it can simply be a deliberate play by the side to have a more patient build-up in possession & a willingness to maintain possession a bit more.
So, how does this directional data transfer to completion rates?
In previous blogs, we mentioned that pass completion rates on their own can be a bit misleading. We believe that pass completion rates should be used in tandem with progressive pass completion rates; giving a greater understanding around why a % may be particularly high (were riskier/more progressive passes attempted more often or were a side happy in simple, no-risk possession?)
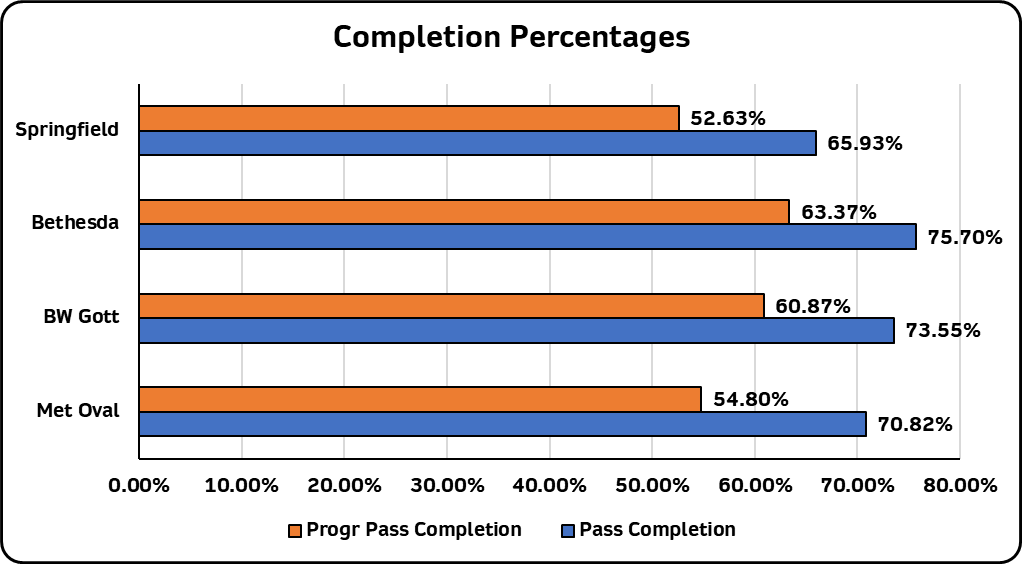
Bethesda SC were the most efficient of the four teams in possession – they completed more passes than the other teams AND more of their passes were completed in a progressive direction (ie. towards their opponents’ goal).
An interesting sidenote here (not on this graph) but where Springfield SYC had the lowest completion rates under both catch-all metrics here, they also had the highest progressive pass attempt rate (63.33% – nearly 3% higher than the next highest). This shows that while they may not have been too efficient in possession on the day, the coaches can take solace in the fact that their players played the riskier/more progressive option more than the other teams in this piece.
We have a vast treasure trove of data output on the four sides in this article. This data is categorized across 64 metrics & available in 1H, 2H and 90 min formats. It can be broken down by team output & individual player performance data output.
At PlayerStat Data, our 360° Player Development data platform will reimagine the way soccer clubs & academies deal with their youth players & their development pathways. Marrying five key facets of player development into one platform, clubs & academies will access a level of insights at PlayerStat Data unavailable anywhere else.
Reach out to us at info@playerstatdata.com for further information – clubs & academies, enhance your own operations by fully powering their players’ development pathways.
Leave a Reply
Your email address will not be published. Required fields are marked *