MLS Next U19 – Possession Data Output
Posted On May 01, 2024

In the first of our MLS Next data posts, we took two U19 games from a game weekend and put the video footage through our data model.

In the first of our series of MLS Next data posts, we decided to take two U19 games from a game weekend and put the video footage through our data model. We collected player performance data from footage on:
• Sockers FC U19 v SLSG Academy U19 05/01
• Met Oval U19 v Boston Bolts U19 04/30
Over the course of the two games, our analysis team collected close to 4900 individual player data points across set-pieces, possession, attacking and defensive metrics. With the data broken down into player position, 1st half, 2nd half and FT categories, we were able to create a vivid & extensive performance data picture of each team across the two games.
For the purposes of this blog, we will concentrate on some interesting outcomes we were able to assess from a possession point of view from the two U19 games.
Note: All metrics in the below piece are available per player, per half and per game where required. Not just overall team totals.
U19 Games
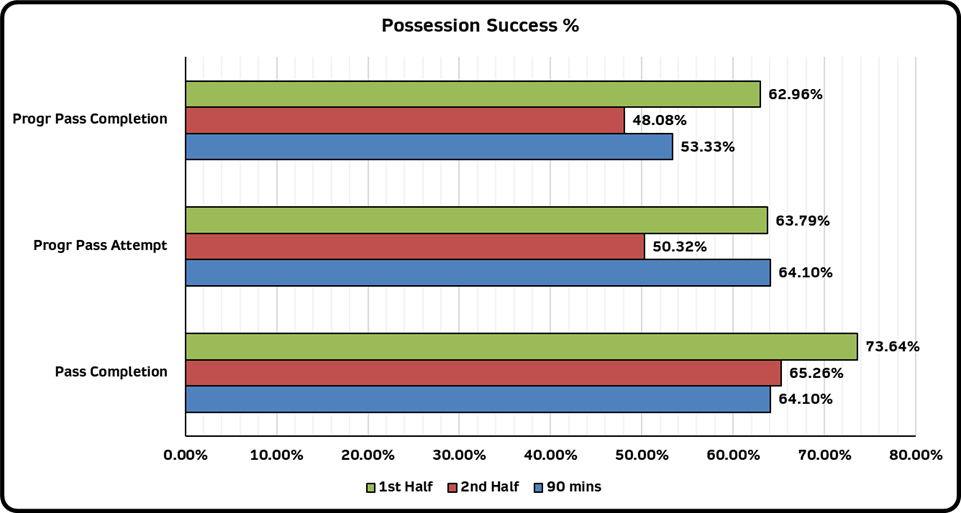
Across the two U19 games, there were some notable findings around certain percentage outputs. Those catch-all metrics that captures the true essence of a particular team’s effectiveness in possession.

At PlayerStat Data, we always feel that the pass completion metric is only useful when accompanied by other metrics. This table represents why we think this way. For context, a progressive pass is any pass played towards the opposition goal.
Met Oval U19s had the highest pass completion rate (86.74%) of all four sides but conversely, they also had the lowest progressive pass attempt rate (46.41%). This suggests one simple style – a conservative possession style on the day & propensity to play the ball sideways/backwards a lot more often than in a forward direction.
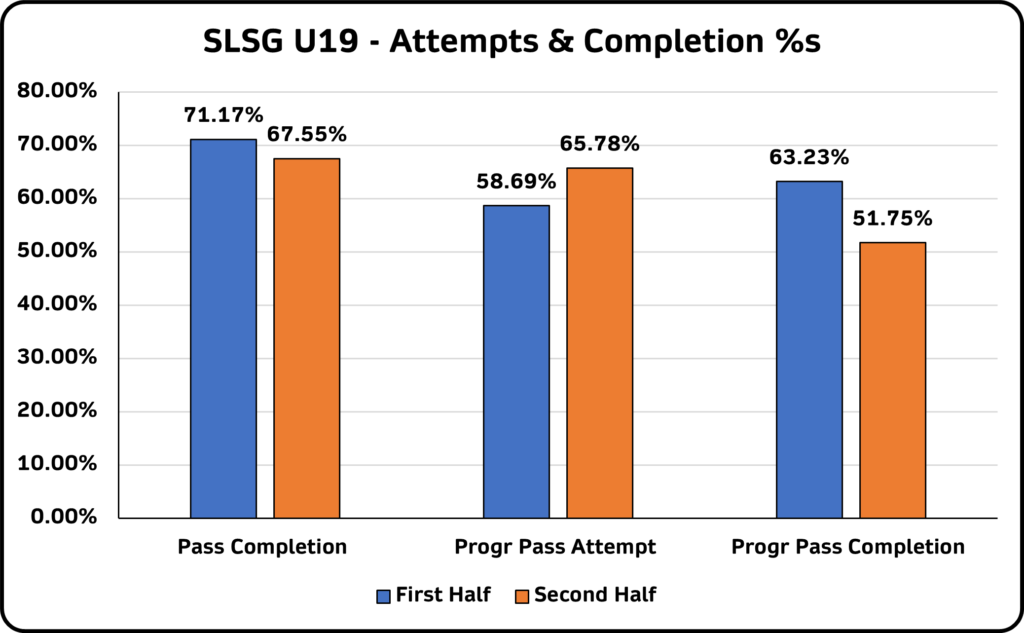
In an opposite, St. Louis Scott Gallagher U19s had a relatively poor pass completion rate (70.85%) compared to the other three teams. When looking at their progressive pass attempt rate (62.73%), we can see a reason for it being so low. A far higher proportion of their passes were played towards their opponent’s goal, thus increasing the level of risk in each possession play. The completion rate on these progressive passes (59.41%) points to the fact that the players’ accuracy wasn’t what it should be on the day, but the coach can take solace in the fact his players were a lot more adventurous in possession than their counterparts.
Possession Totals
Simply put, here we were able to tally up & promote the number of overall successful pass attempts per team, unsuccessful attempts & the total number of attempts per team. Useful as a reference & as a measure of possession domination etc. but it doesn’t tick many other boxes outside of that.
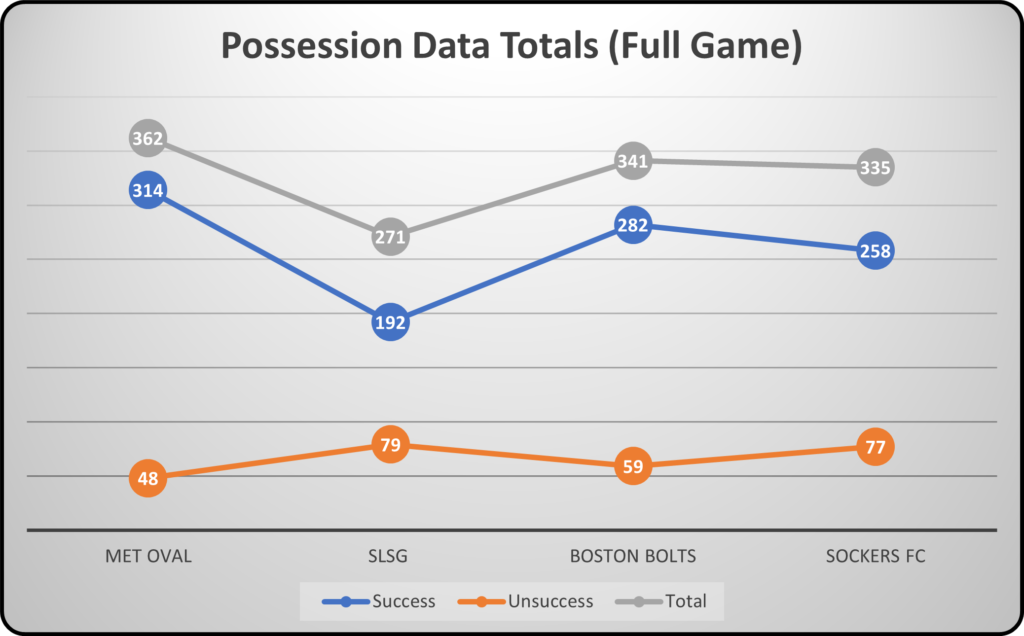
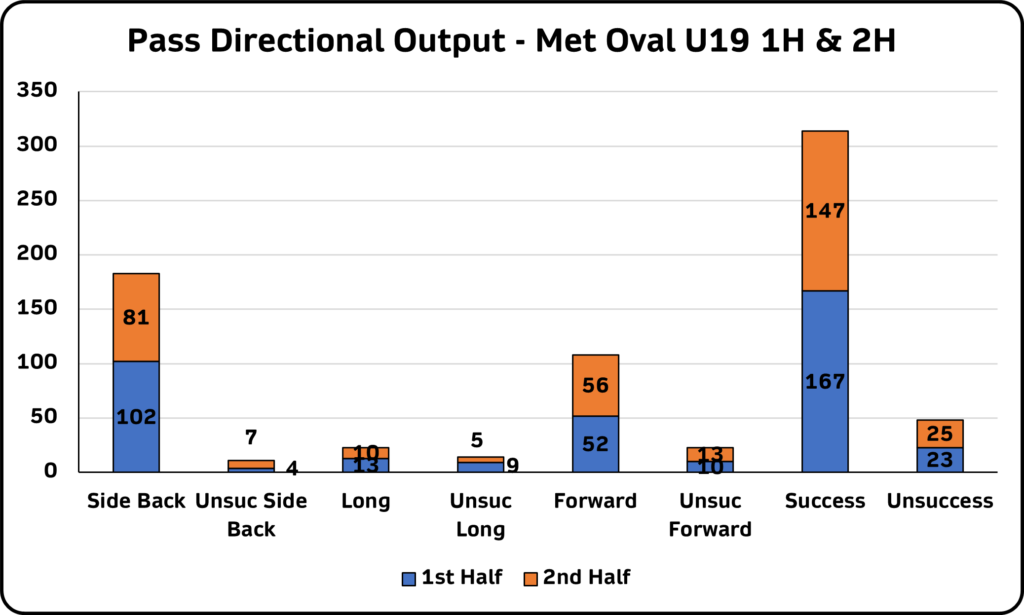
When we add pass directional data into the mix, this gives far more context & weight to these outputs. Where did the team stand out in possession? Were the totals boosted by a high proportion of side/backwards pass attempts?
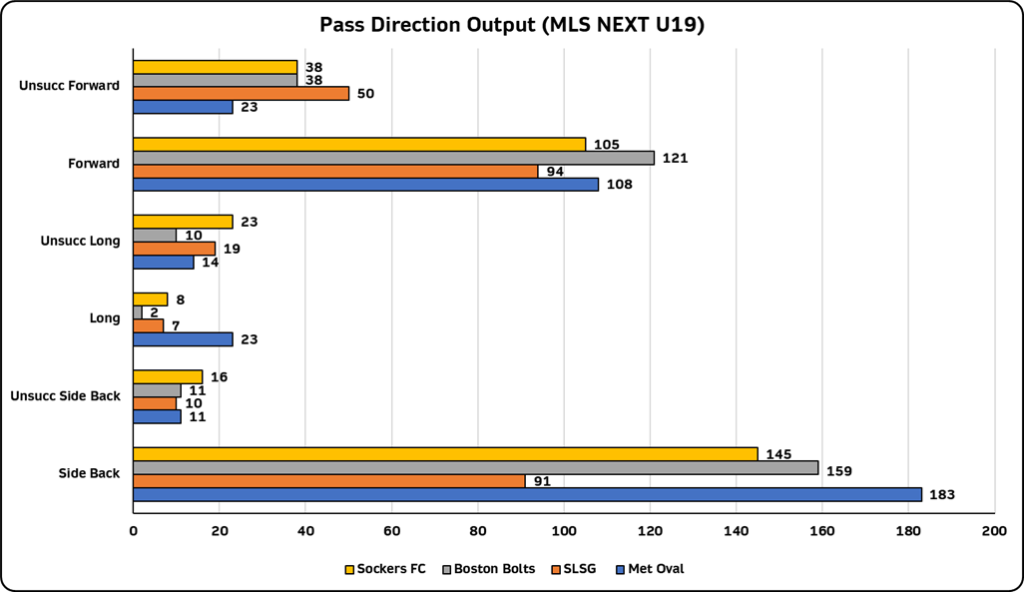
Let’s go into some slight detail on each side’s output across various categories:
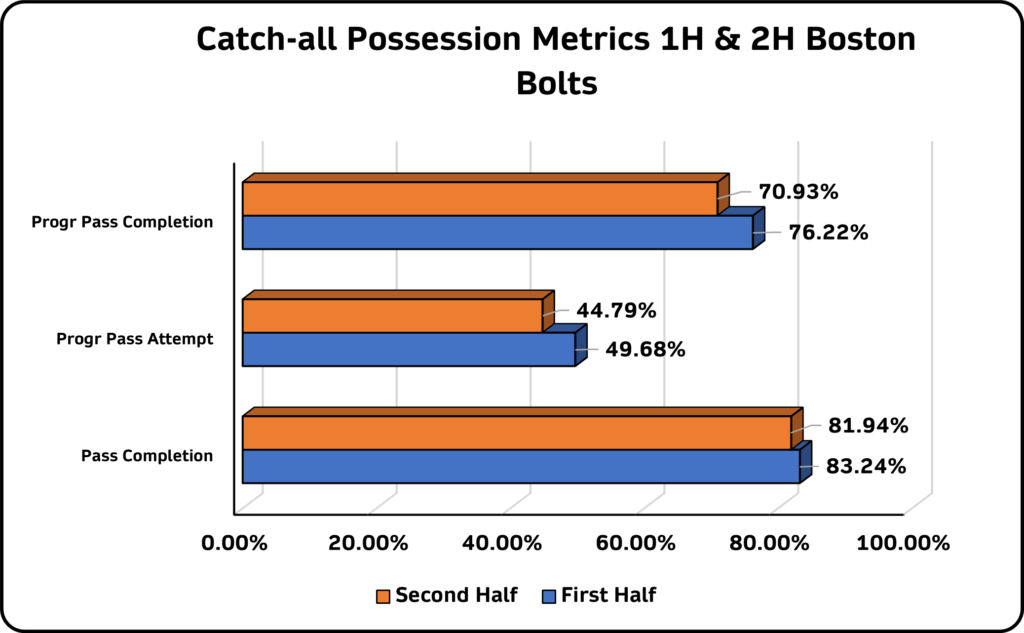
- Boston Bolts: When looking at the catch-all metrics of Boston Bolts U19’s performance against Met Oval U19, consistency across the two halves is relatively apparent. There doesn’t appear to be wild disparities across the metrics in both halves; something that is bound to please the coaching staff.
- Sockers FC: There are slight disparities across both halves for the coaching staff at Sockers FC to look at. It is clear from the chart that Sockers FC had a greater possession involvement in the 2H & were slightly more conservative than they were in the first half. Whether a result of the momentum of the game or the direction of the coaching staff, it is something for the staff to look into.
- St. Louis Scott Gallagher: An interesting point to note here is the change in progressive passing in the second half. There was a shift in possession outlook between the first half & the second half, with a marked increased change in attempts % and a marked deterioration in progressive pass completion %s between the first & second halves.
- Met Oval: A very possession heavy performance by Met Oval in their game against Boston Bolts – interesting to note the decrease in pass attempts from the 2nd half, when compared to the 1st half.
At PlayerStat Data, our 360° Player Development data platform will reimagine the way soccer clubs & academies deal with their youth players & their development pathways. Marrying five key facets of player development into one platform, clubs & academies will access a level of insights at PlayerStat Data unavailable anywhere else.
Reach out to us at info@playerstatdata.com for further information – clubs & academies, enhance your own operations by fully powering their players’ development pathways.
Leave a Reply
Your email address will not be published. Required fields are marked *