St. Patrick’s Athletic – Performance Data Season Review
Posted On May 01, 2024

ow, we are happy to introduce our first dive into the statistical performance within a LOI team

An eventful season for St. Pat’s – going over 600 mins without scoring a goal at one point, but still ended up fighting for Europe on the last day. An inability to convert chances haunted them, with a massive disparity between the actual goals scored and the much vaunted xG total.
On the plus side, from a watcher’s point of view, a back 5 that collected 8 clean sheets from 18 league games and a centre-half partnership that was a joy to watch. Now, we are happy to introduce our first dive into the statistical performance within a LOI team.
All stats highlighted are for players who played a min. of 270 league mins this season.
Goalkeeping – as mentioned in previous articles, our GK model is still under development. A statistical breakdown of Brendan Clarke’s performances is not available at this point, but he continues to be one of the most consistent GKs in the league for a long time. 8 clean sheets out of 18, played every minute of the season (keeping a highly-rated Conor Kearns out of the side) and named the club’s Player of the Year. He also pushed Alan Mannus close for the GK place in our own Team of the Season.
Defensive metrics
The simplest stat of all, that gives an indication into how well a side defended, is goals conceded. 0.94 goals conceded per 90 mins (17 in total), and a number of these were easily avoided. It was a good season at the back for Pats, switching between a back 3, back 4 and back 5 when suited. They were well aided by Jamie Lennon, sitting just in front and covering every blade of grass.
Def 1v1: When isolated one-on-one against an opposition player, Rory Feely came out on top. What can also be described as ‘standing challenges’, Rory led the way with 5.18 successful def. 1v1 situations per 90 mins. Interestingly, he was also the player with the highest number of def 1v1 situations (139) and highest success rate (63.7%).
Coming in 2nd and 3rd respectively were Jamie Lennon (4.88) and Robbie Benson (4.39); Lennon, as mentioned earlier, was a fine defensive screen for the defenders, but Benson is an interesting 3rd place. He was very dynamic throughout the season, winning back a lot of possession and driving the side into attacking transitions.
Tackles: Speaking of Lennon, he led the side in successful tackles/90 mins (1.22) over the season. We define a tackle as any sliding challenge made to dispossess an opponent. Having made 16 successful tackles (same number as Luke McNally), Lennon’s success rate/90 was higher due to the lesser number of mins played over the season. Rory Feely wins the tackle success % metric however, with 68.75% success rate based on 16 attempted tackles.
Def Aerial duels: Luke McNally stands out above the rest here by a long way. 4.17 successful aerial duels/90 and 71.43% success rate (beating Rory Feely into second place in both rankings). McNally was also involved in 105 direct defensive aerial duels (i.e. under sustained physical pressure from an opponent when defending the ball in the air). Imperious form in the air.
Progressive Regains %: Our final metric in this piece for ranking the defensive side of the game is the progressive regain %. The amount of times that a player regains possession of a loose ball or through an interception, but then follows up with a positive action. Lee Desmond stood out ahead of the rest here, with 86.28% progressive regain success rate. He was closely followed by the other two usual suspects McNally (85.46%) and Feely (84.80%).
Summary: It is hard to pick out who stood out as the top defensive performer for St. Pat’s this season; Feely and McNally ran each other very closely. We think that McNally just edges it, standing out in aerial duels. We will sit on the fence for this one and let the reader decide for themselves
Attacking Metrics
Goal Scoring: A huge problem for the team was scoring goals. They went 600+ mins without scoring at one point & were huge underperformers in front of goal. Based on shot location only, their total season xG was 29.4; from 231 efforts on goal. The actual number of goals scored – 14 (including one own goal). A poor return for a side who can point to chances missed as a huge factor in missing out on a spot in Europe.
The table below will give you the four xG leaders & goalscorers this season:
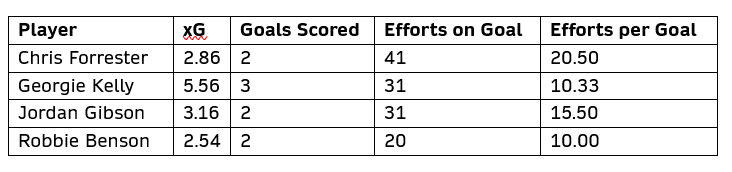
Chances Created: From a creative sense at the attacking end, we feel that chances created tells a far clearer story of a player’s influence. The ‘chance creator’ is powerless as to whether it is an assist or not (down to his teammates’ ability to finish), but using chances created as a metric, this gives a clear indication of who the creative influences in the side are. Jason McClelland is top for chances created/90 (5.52), nearly one full chance per game ahead of Chris Forrester (4.58). This is more impressive, considering Forrester played twice the number of mins that McLelland played.
Attacking Aerial Duels & Hold Up: This metric was always going to be dominated by the big centre-forward; target for many long passes. Not surprising to see that Georgie Kelly stands out, with an att. aerial success/90 rate of 4.76. Martin Rennie came in 2nd with 3.40. This direct approach towards goal & tactic of gaining territory in the opponents’ half is mirrored by the successful hold-up output also.
We define successful hold-up play as the attacker with his back to goal, under pressure from an opponent & either lays off to a teammate or wins a foul (i.e. gaining territory or advancing possession up the pitch). Again, Georgie Kelly led here with 67.57% success rate (37 attempts). Notable mention to Jordan Gibson – from a much smaller number of attempts (11), he was successfully held up the ball 81.8% of the time. Georgie Kelly was picked here due to him being a lone target-man & the sheer number of occasions he was in possession, under pressure and with his back to goal.
Attacking 1v1 & dribbles: Simply the attacking player, in possession, beating the defender in front of him. Jordan Gibson stood out ahead of the rest here, with 3.23 successes/90 mins. He also led the “attacking” players in dribbles (35) – interestingly, Lee Desmond was miles ahead here overall; 61 dribbles. A player who was extremely comfortable bringing the ball out from the back, and who also led the team in Att 1v1 success % (94.12%).
Summary: From our performance data output, it is difficult to pick out the top attacking performer this season. Goals scored isn’t as strong an indicator as with other teams – Jason McClelland stood out in a creative sense through chances created. Georgie Kelly was dominant in the air in an attacking sense, but Jordan Gibson stood out in attacking 1v1 situations, was adept at holding the ball up and had a high number of dribbles also. We think Gibson slightly edges it here but again, happy to let the reader decide for themselves
Possession Metrics
We tagged 6267 passing attempts for St. Pat’s over the course of the season (both successful and unsuccessful). With regards to pass direction:
Side/Back 2912
Forward 2319
Long 318
Penetrative 905
Through Ball 53
But who was the best passer in the St. Pat’s team? Pass completion can be a poor indicator of “best passer”; it doesn’t take direction into account; Ian Bermingham leading with 89.29% completion on 439 passes. The same player also leads successful passes/90 mins (46.61). Only Chris Forrester (44.83), Lee Desmond (43.40) and Jamie Lennon (42.75) had over 40 successful passes per 90 mins.
We feel that progressive passes are a far more insightful metric; passes towards the opposition goal. On this count, Luke McNally leads with 73.00% of his passes made towards the opponent’s goal; finding his target with 82.45% accuracy. He was also very safe in possession overall; being dispossessed or losing possession of the ball on just 3 occasions over the entire season.
On a slightly negative note, unsuccessful receptions were high, compared to other teams. We defined these as occasions where a player would be expected to gain control of the ball, able to develop possession / take a shot from that touch. Georgie Kelly unfortunately was out in the lead in this metric, unsuccessful on 46 occasions. For every player that played 270 mins or more, there were 290 occasions where a player was unable to establish control/possession of the ball.
Player of the Season: Our data collection is completely objective; no opinion, no punditry and no “should have done better there”.
With that in mind, Luke McNally stands out as our St. Patrick’s Athletic Player of the Season. He was Pats’ best player in possession from a progressive standpoint & in terms of safety in possession. He was imperious defensively in the air & could also be the statistical leader in defensive ground play as well. His progressive regains % was also up among the highest at the club, a fine all-round performance from the player this season.
Leave a Reply
Your email address will not be published. Required fields are marked *