Waterford FC – 2021 Possession Data Outputs
Posted On May 01, 2024

A short blog on the possession data outputs of Waterford FC this season. What can we tell from the possession data outputs from the current & old managerial regimes?
Waterford FC possession data outputs
Waterford FC have had an up and down 2021 season so far – off the field controversies, Covid postponements, a change in manager(s) and now a change in ownership. There has been an upturn in form on the pitch and a bit more optimism off the pitch as well; in this blog, we’ll take a look at the difference in possession approaches under the two regimes this season.
Please note, these insights are purely data-driven – any soft changes (player confidence, change of personnel etc.) are not factored in here.
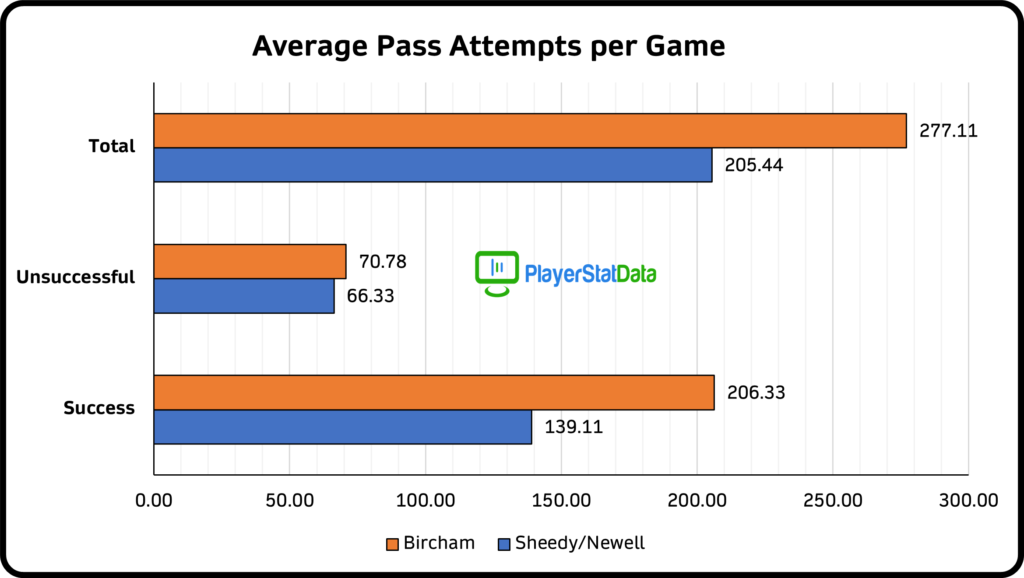
Under Marc Bircham, there appears to be a bit more patience in possession – a tendency to favour shorter passes at times in order to return to shape and/or take the sting from games (a tactic that drew the ire of a number of impatient RSC ticket holders in the recent win against Sligo Rovers). Under Sheedy/Newell, the approach was more direct and didn’t favour a long build-up in possession. The graph above shows two standout outcomes:
- A 34.88% improvement in the average # of total pass attempts between the first managerial regime and the current regime.
- A 48.32% improvement in the average # of successful pass attempts between Sheedy/Newell and Bircham.
Interestingly, a relatively minimal difference between the average unsuccessful pass attempts per game between both regimes.
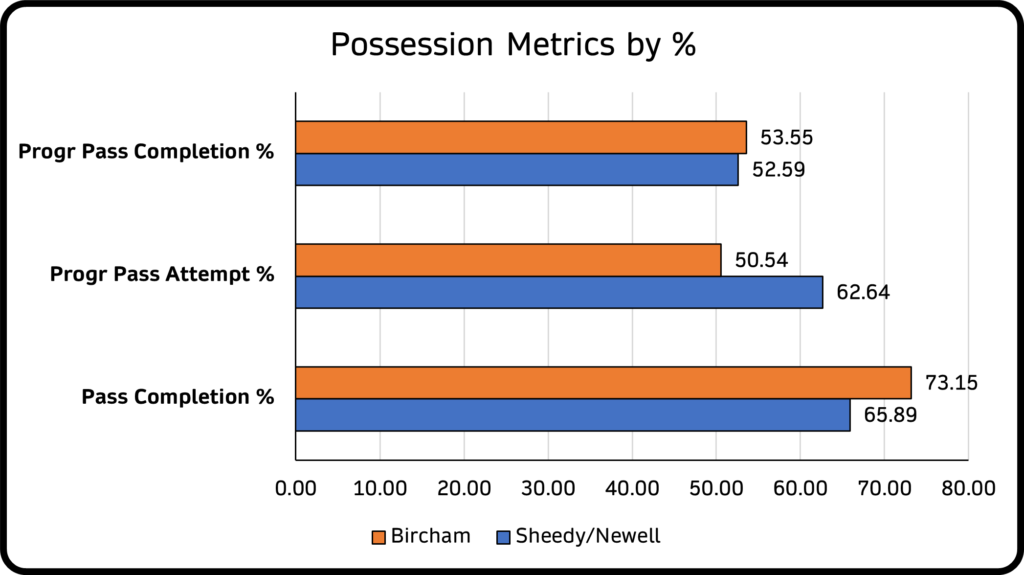
This patient, buildup style is apparent in the overall possession metrics by % also. With approximately a 7.5% differential between pass completion %s, the standout here is the progressive pass attempt rate. Simply put, this means the % of passes played towards the opposition goal.
The Sheedy/Newell ‘direct’ style, while not easy on the eye or overly effective, resulted in a far higher progressive attempt rate than the current Bircham approach. Patience appears to be working in the side’s favour, especially with players comfortable in possession now being allowed to keep possession that bit longer. The progressive pass completion rates have a minimal difference also.
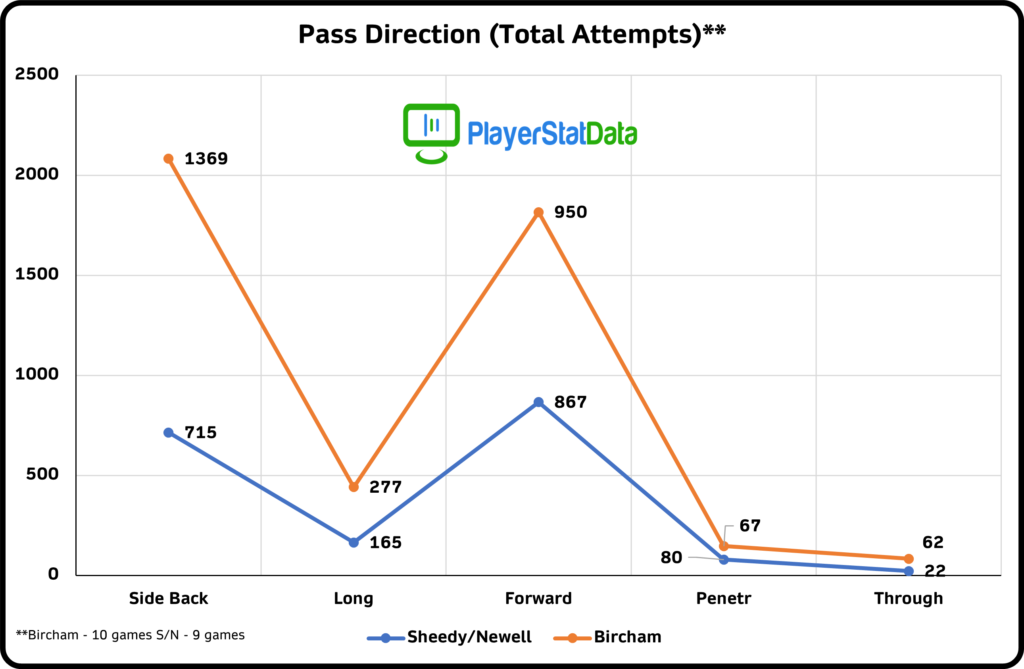
Where are the passes played?? Pass completion rates are a handy catch-all but don’t tell the full story of a side’s possession intent. Progressive pass rates and pass direction are far less available but are far more insightful for those interested. Short, regular passing attempts are a feature of the team under Bircham with 85.10% of all possession attempts either sideways/backwards or less than 20m towards the opposition goal.
It is interesting to see that 50.23% of all pass attempts under Bircham are played in a sideways/backwards direction – while it may not please the “get-the-ball-up-the-pitch” brigade among Waterford FC fans, maintaining possession of the ball is clearly having a positive impact on the side’s performances under Bircham.
The direct approach under the last regime is also obvious from these pass direction outputs, with just 38.67% of pass attempts under Sheedy/Newell played sideways/backwards. Players looked to move up the pitch sooner but as we had seen in the previous graph, the completion rates didn’t match the intentions.
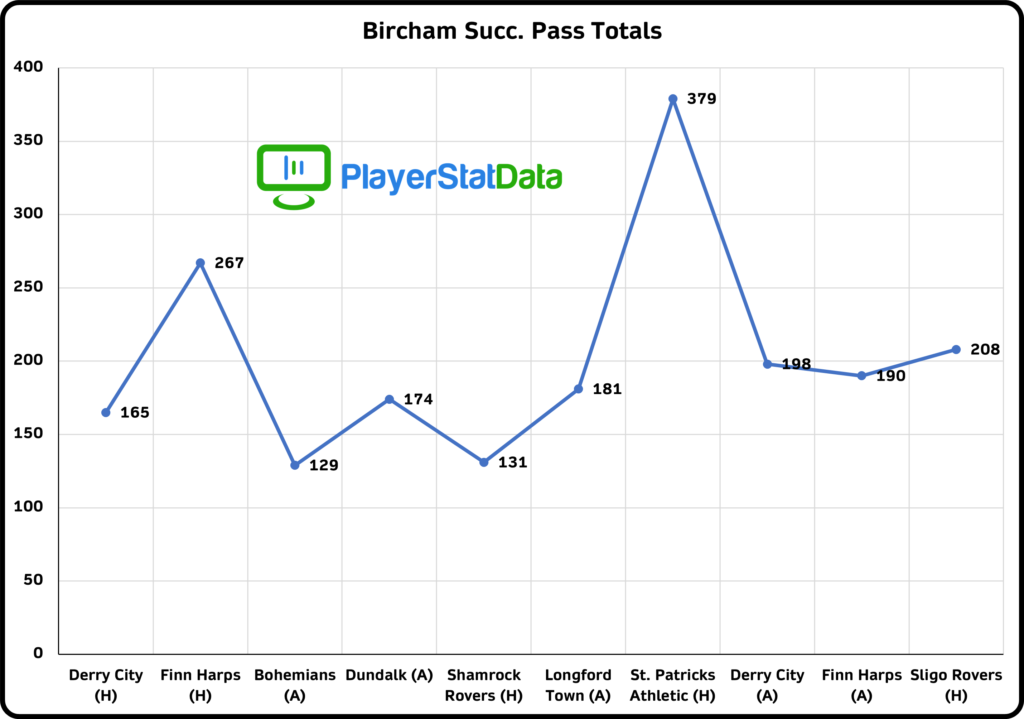
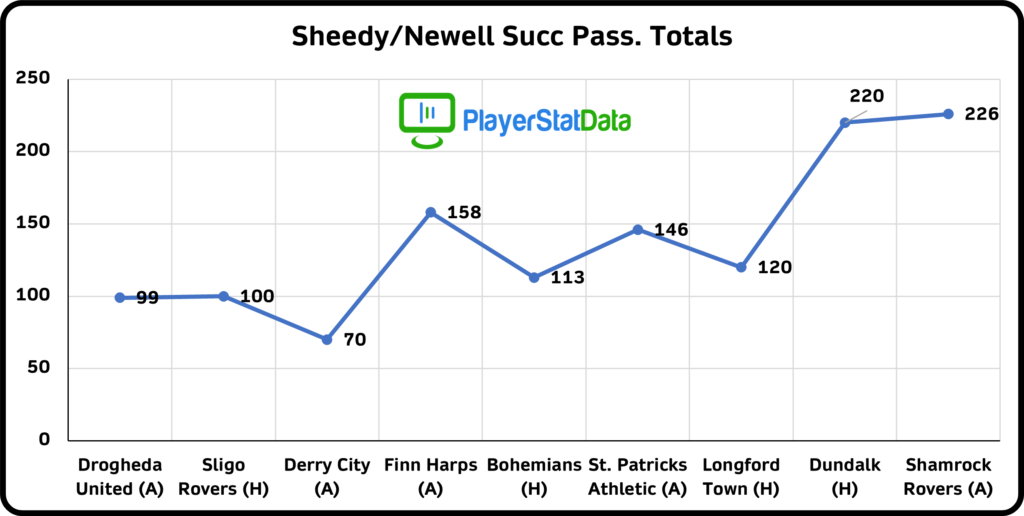
The final two graphics in this blog show the breakdown per game of successful pass attempts.
The trajectory of the Sheedy/Newell success line is interesting, showing a steady rise to 226 successful pass attempts (final game against Shamrock Rovers) from a start of 99 succ. attempts against Drogheda United. The jump at the end of the graph (from 120 against Longford Town to 220 and 226 against Dundalk & Shamrock Rovers) is open to interpretation as well – was the two managers’ approach being finally understood by the players & things were going to turn around or were these possession performances just outliers?
Under Bircham, (except the two major peaks against Harps and St. Pats that skew the line), the progression is ‘relatively’ steady…growing from 165 against Derry City to 208 successful passes against Sligo Rovers. As we have pointed out earlier in the blog, it is safe to assume that half of all these successful pass attempts are conservative and in a sideways/backwards direction but it would be interesting to compare these successful pass attempt numbers to the game outcomes also (i.e. did the games that produce 3 points result in Waterford FC being in control of possession or holding on? Conversely, in the defeats, were Waterford FC pressing the issue in possession or were they struggling to make an impact on the opposition?)
There are a raft of soft factors around why the first managerial regime was a disaster and why there now is a bounceback among the club and fans under the new manager. Our blog is, however, focused solely on team possession data outcomes & styles, as opposed to highlighting that Player A is getting in possession further up the pitch or Player B is less suited to Role C.
It is clear to see that this club, as the new owner puts it, is a sleeping giant. Whatever issues may linger off the field, the hope is that the new owner will listen deeply to all stakeholders & assess what needs to be changed/fixed.
As far as on the pitch goes, the changing and fixing is there for all to see so far.
![]()
Leave a Reply
Your email address will not be published. Required fields are marked *