FC United Chicago U17 v SLSG U17 – Possession Data Output
Posted On May 01, 2024
In our second MLS Next series blog, we’ve looked at a recent game between FC United Chicago U17s and SLSG Academy U17s.
![]()
In our second MLS Next series blog, we’ve looked at a recent game between FC United Chicago U17s and SLSG Academy U17s. Player on 04/30, the game finished in a 2-1 win for FC United SC. Similar to our previous MLS Next blog, we decided to take out some interesting possession insights from both sides on the day.
Note: Without teamsheets/lineup details available for our analysis team, we tagged by position only. This includes substitutions, so for the purpose of the article, the position’s (eg. ATT) total output covers any players who played in this position for their respective side.
FC United Chicago
When looking at possession data output, we realised that with a small sample we couldn’t do much in the way of comparisons with other teams. We looked to drill down into individual possession data outputs across both sides & see what we could take from the 1H, 2H and full-time data totals.
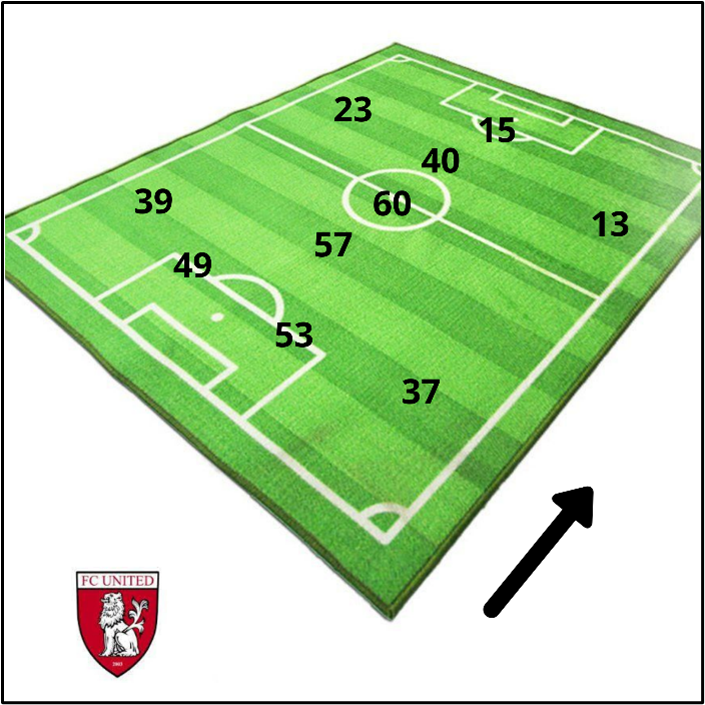
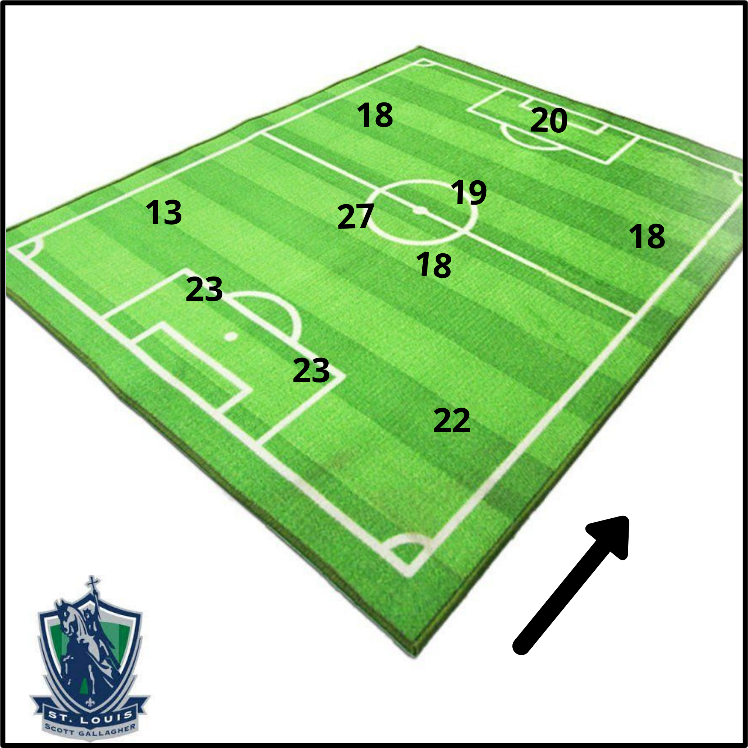
In the above graphic, you will see pass totals per position across the full game for FC United Chicago players. The first standout from this graphic is the central emphasis on possession – through both centre backs, the #6, #8 and the #10 AM.
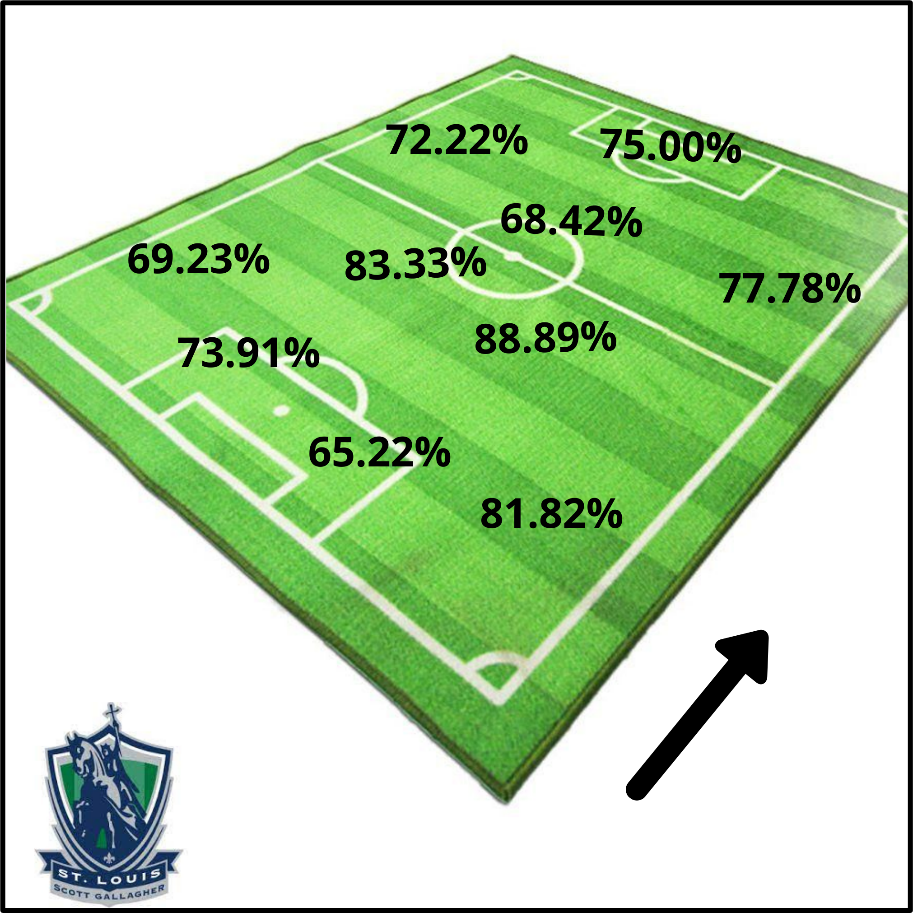
We mentioned in the previous article that the pass completion rate per player only tells part of the story, but in this instance, how does the pass completion rate look when we have identified the concentration of possession through the middle? How well do players in these positions use the ball?
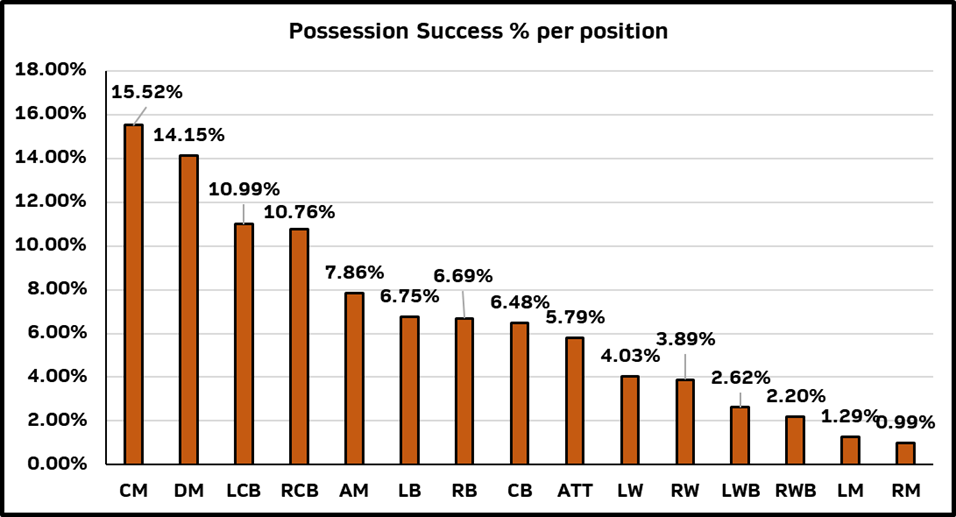
The FC United players are clearly comfortable in possession & most are efficient with their use of the ball. Considering the central focus of their play, those 5 positions mentioned in the previous paragraph are not wasteful in possession. This gave FC United a firm foundation to build from & make life more difficult for the opposition.
What did the players do with the ball though? How progressive/conservative were they in possession?
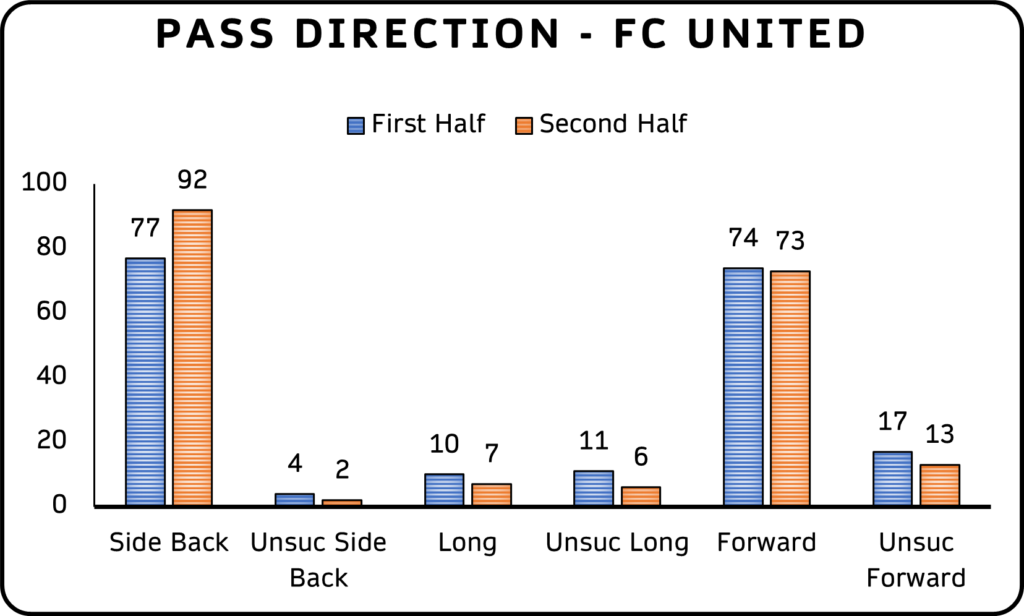
From this chart, we can see that the greatest proportion of successful passes made were conservative in nature (ie. 43.78% of passes were side/back passes). This isn’t as damning a stat as it may seem, with 38.1% of successful passes in a forward direction. It does show a sense of patience in their play – how much of this came from central positions in the team? How conservative/progressive were these five central positions when in possession?
When looking at these five positions & their possession output versus the team’s total, there are some interesting outcomes. The #6 (DM) is heavily involved in the side’s play & interestingly, was heavily reliant on a long pass as a tactic (a long pass at PlayerStat Data is any pass that is 25+m in length).
Both centre backs, unsurprisingly, were key when it came to forward passes – getting the side on the front foot and moving the ball up the pitch. Through our possession chain insights, we would be able to take every chain involving both centre backs & decipher which player was found most often with their passes (safe bet to assume the focal points was the #6).
SLSG Academy
A difficult game out of possession for SLSG Academy – with just under 30% possession throughout the game (29.42%). What can the data output tell us around SLSG Academy’s possession in this game?
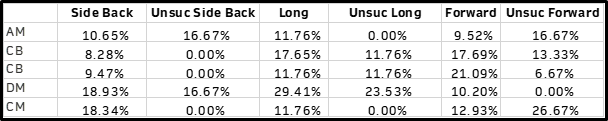
Compared to their opponents, SLSG Academy were a lot more even-handed across the 10 outfield positions over the 90 mins. This had a lot to do not being able to dictate the play as much & FC United dominating possession. How did their pass completion rate?
A bit of a mixed bag of pass completion outputs here, ranging from a high of 88.89% and a low of 65.22%. The right-sided triangle between the RB, the right-sided CM and the RW appears to be their strongest element in possession. How conservative/progressive were the players in possession?
The SLSG Academy pass directional output shows the reversal of possession fortunes between the first half & the second half. Forced into more long pass attempts (ie. passes over 25m) and far fewer attempts in other directions, SLSG were not able to impose themselves as much in the 2nd half as in the 1st.
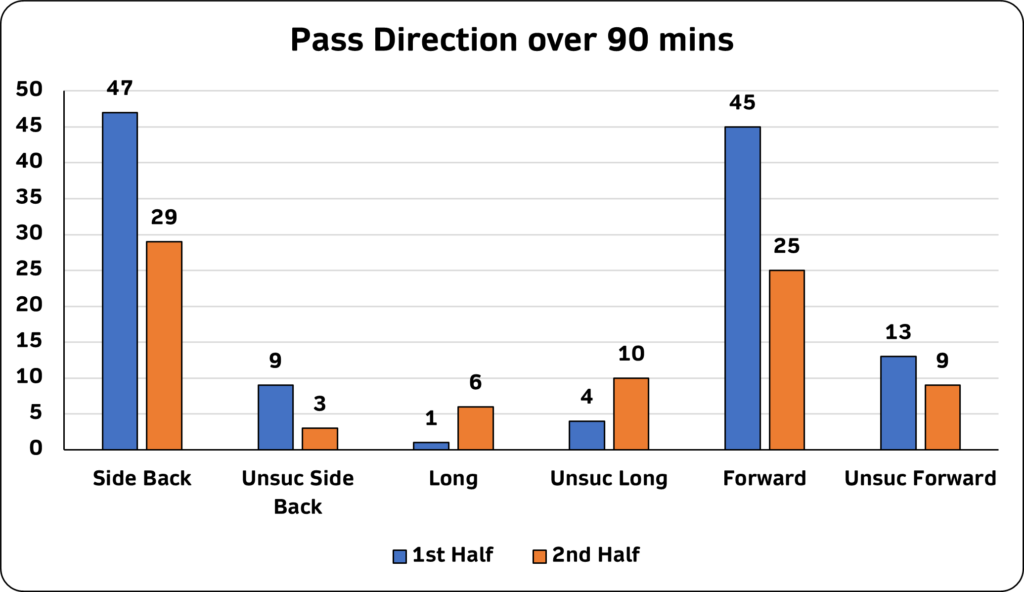
This second half differential is even more stark when compared to the second half output of the opposition.
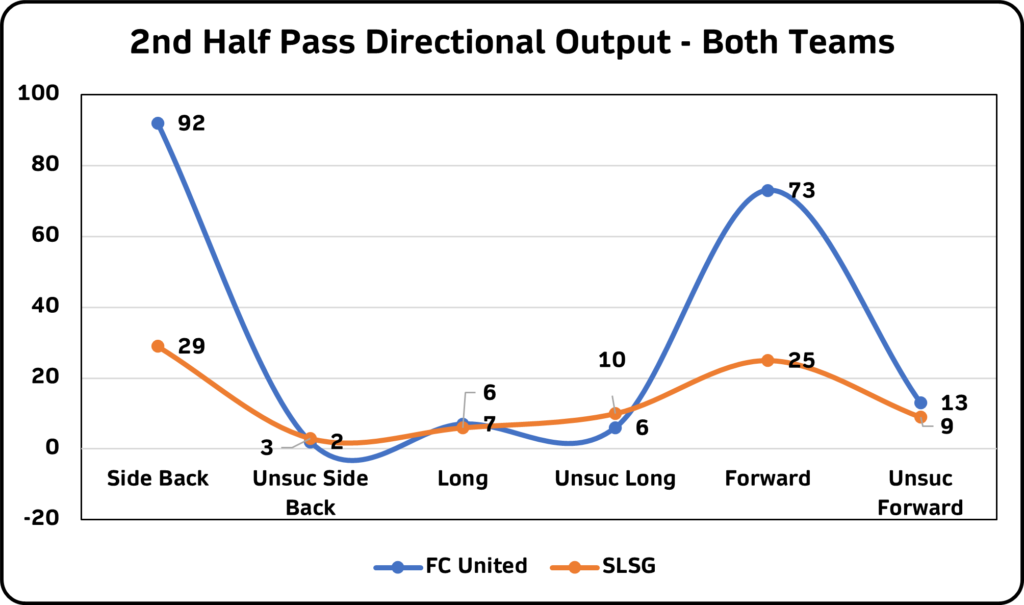
Some interesting findings on both sides from a possession point of view but the style of play & momentum of the game is clear to see from this simple possession data overview.
Our analysis team collect data on over 60 individual player performance metrics & our data platform allows users to access these metrics in categories such as First Half, Second Half and Total Game Data. The data is broken down by player, by position and also by team total.
At PlayerStat Data, our 360° Player Development data platform will reimagine the way soccer clubs & academies deal with their youth players & their development pathways. Marrying five key facets of player development into one platform, clubs & academies will access a level of insights at PlayerStat Data unavailable anywhere else.
Reach out to us at info@playerstatdata.com for further information – clubs & academies, enhance your own operations by fully powering their players’ development pathways.
Leave a Reply
Your email address will not be published. Required fields are marked *